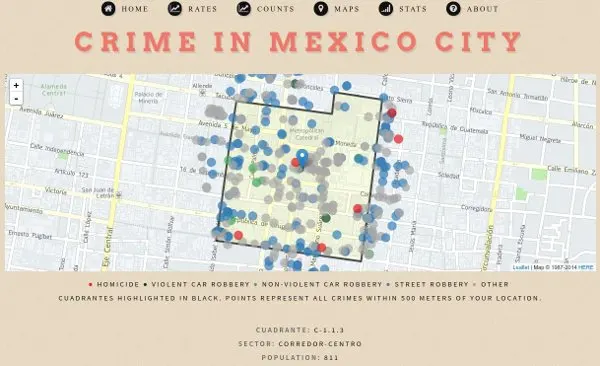
Use the hoyodecrimen.com API to create maps of Mexico City crime by latitude and longitude
Tag: gis | Atom Feed
Use the hoyodecrimen.com API to create maps of Mexico City crime by latitude and longitude
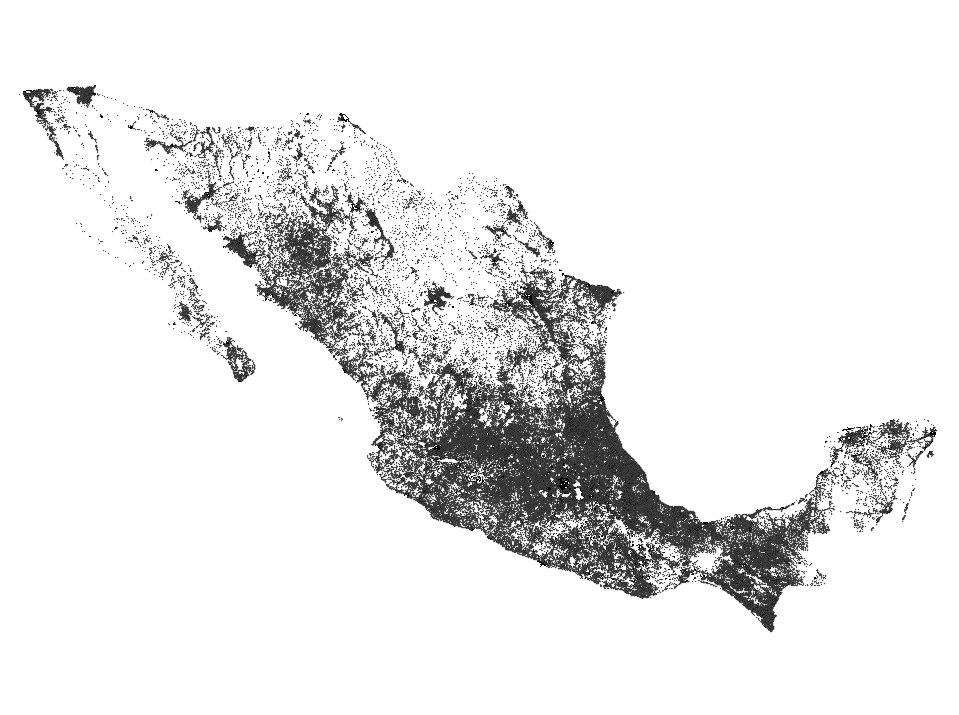
This is an interactive map of all rural AGEBs that contain no localities and thus are empty of permanent residents. If you compare it to the US version, the total area with no people living inside it is much smaller since the data in Mexico is only available at the AGEB level (kind of like Census Tracts), whereas the data in the US is available at the Census Block level which are much smaller. Since there are no polygons available for rural localities, only points, I counted all rural AGEBs that contained a locality as being inhabited.
This post has been superceded by hoyodecrimen.com
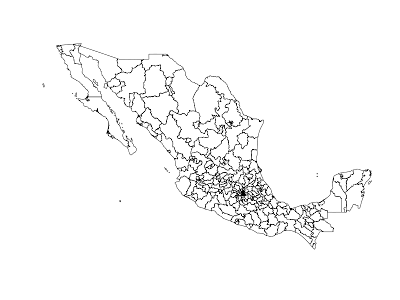
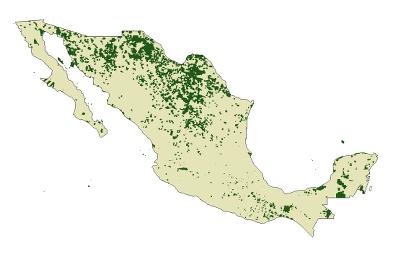
My post on how to download electoral shapefiles proved to be very popular, so I decided to create another script to download shapefiles of census geographies.
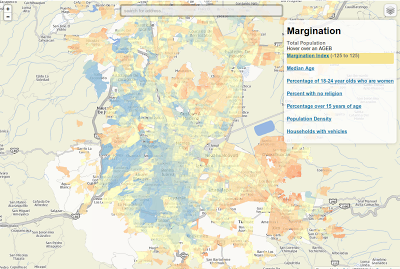
Just some maps of the Mexico City metro area based on the 2010 census. You can search by address and switch to satellite view. If the maps seem slow I suggest you use chrome.
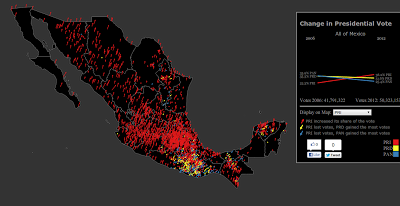 |
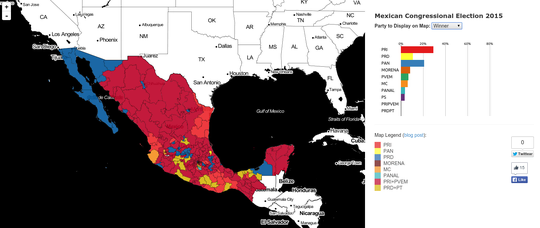
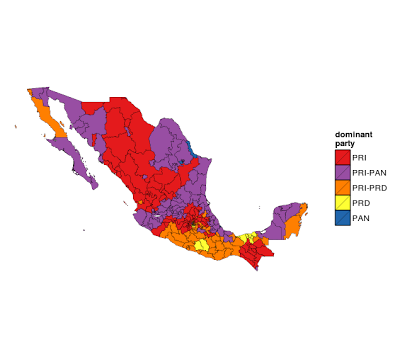
| Click on the image to visit the interactive version (Spanish) |
I liked this visualization by the New York Times of the US presidential election so much I decided to recreate it using Mexican data, and in the process added a slope graph. So go visit my new visualization of the change in presidential vote from 2006 to 2012 at the municipality level. I recommend using chrome to view the visualisation, there’s also a Spanish version.
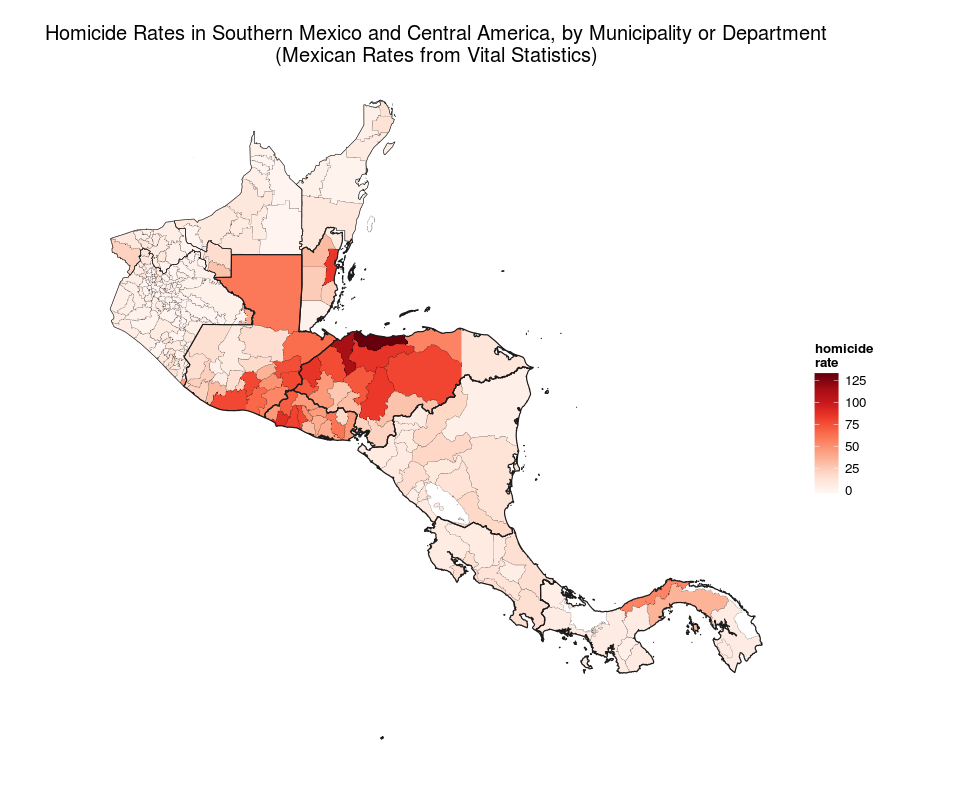 |
| Rates for Panama and Nicaragua are from 2009, all other countries 2010. Municipalities which are part of a metro area in Mexico are shown with the metro area homicide rate. |
Visit the interactive map of homicides
Having just posted on violence along Mexico’s northern border, I figured it’s time to analyze what is happing south of Mexico where some countries have experienced sharp increases in homicides.
Unless otherwise stated, the content of this page is licensed under the Creative Commons Attribution 3.0 License, and code samples are licensed under the Apache 2.0 License. Privacy policy
Disclaimer: This website is not affiliated with any of the organizations or institutions to which Diego Valle-Jones belongs. All opinions are my own.
Special Projects:
Blogs I like: