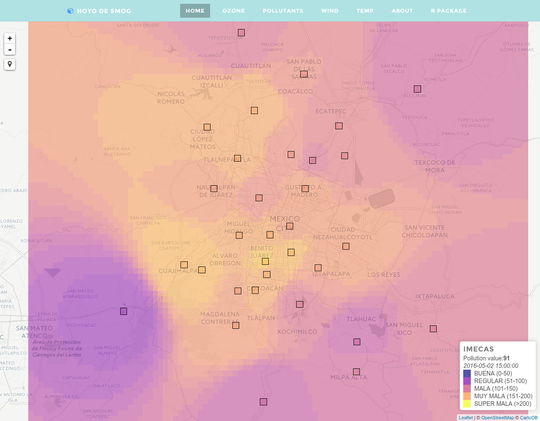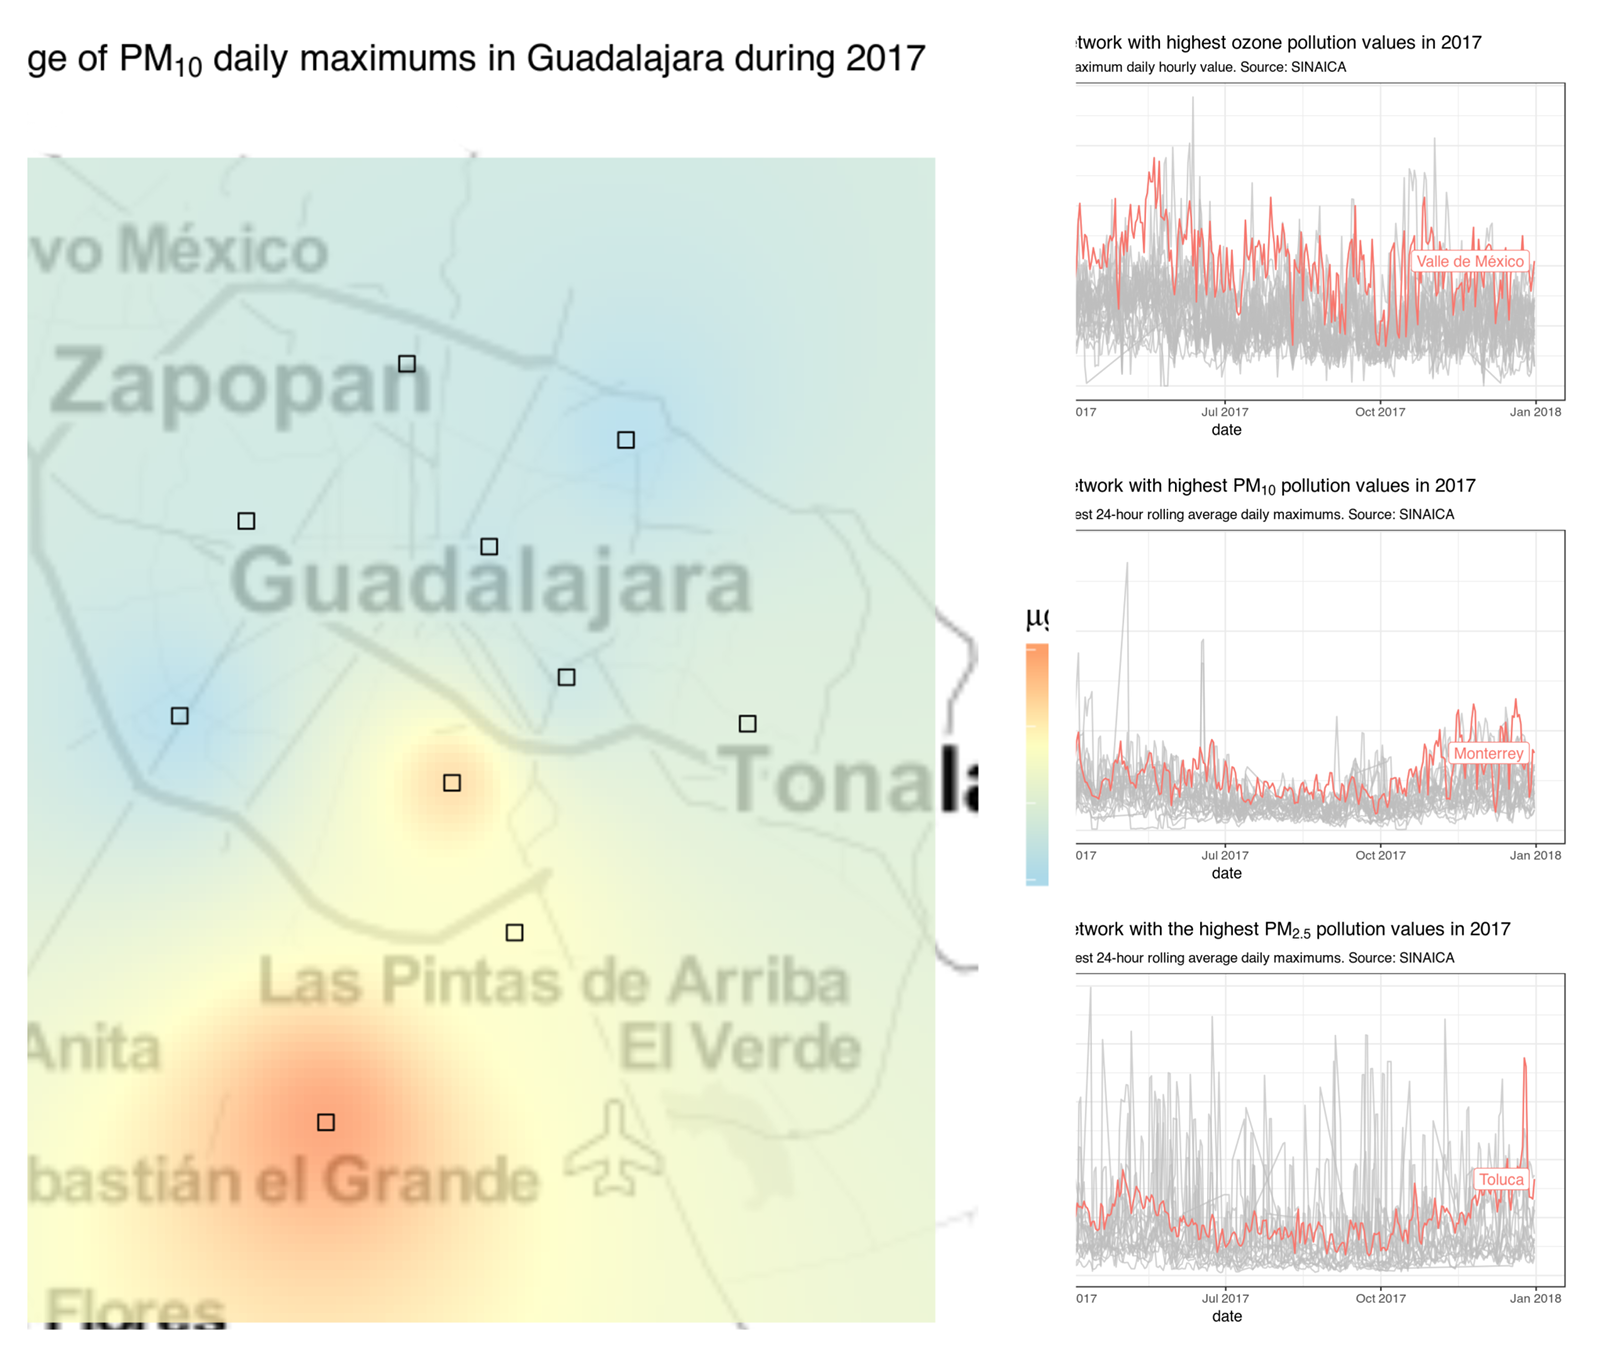
R package to download air quality data from more than a 100 monitoring stations throughout Mexico
Tag: r | Atom Feed
R package to download air quality data from more than a 100 monitoring stations throughout Mexico
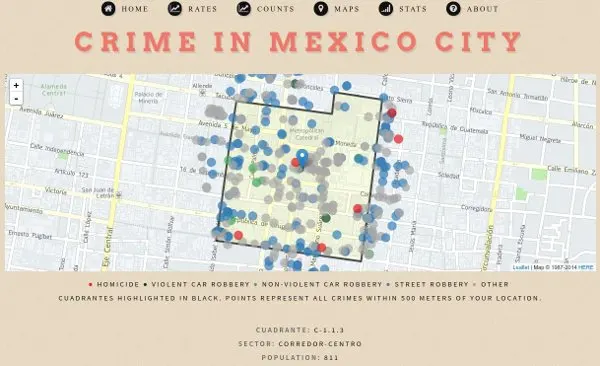
Use the hoyodecrimen.com API to create maps of Mexico City crime by latitude and longitude

The 2015 population survey marked the first time since the 19th century that the Mexican government included a distinct category for people of Afro-Mexican descent.

I’ve updated the mxmortalitydb package to include 2013 data. This data only package includes all injury intent deaths (accidents, homicides, suicides, and unspecified intent) that were registered in Mexico from 2004 to 2013. You can use the package to calculate changes and trends in homicide rates in the most violent metro areas (or large municipios) or at the national level.

Ever since the end of the Mexican Revolution and the Cristero War violence in Mexico inched down in fits and starts from a high of about 60 homicides per 100,000 people to its lowest level sometime during the middle of the last decade (there’s some uncertainty about the number of homicides in 2007). Then, the drug war happened and the homicide rate shot straight up.
After reading The Better Angels of Our Nature: Why Violence Has Declined, by Steven Pinker, and looking at reviews of the literature on homicide decline in Europe, it seemed to me as if some of the posited reasons for the decline of violence would involve strong cohort effects —each generation successively becoming less and less violent. This immediately reminded me of Mexico, and so I decided to take a quick look at the data:
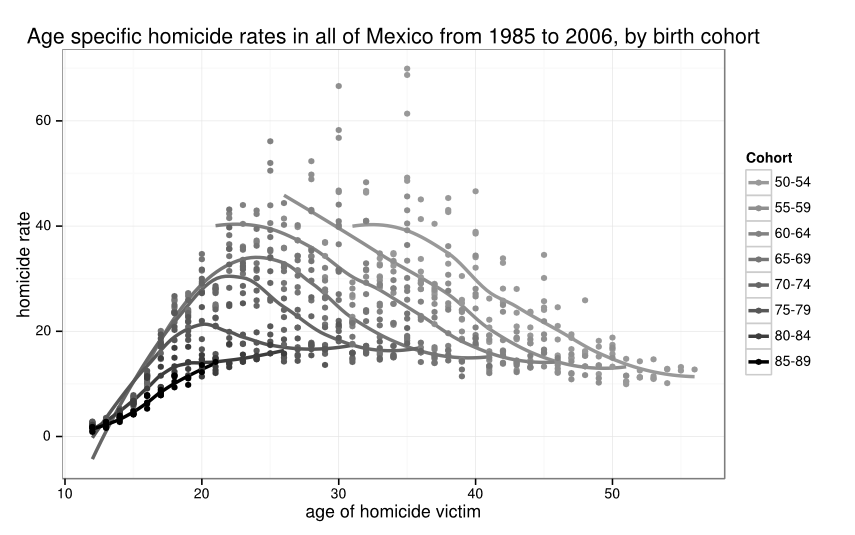 |
| Each cohort group is connected by a loess line(only ages 12-60 are shown in the graph) |
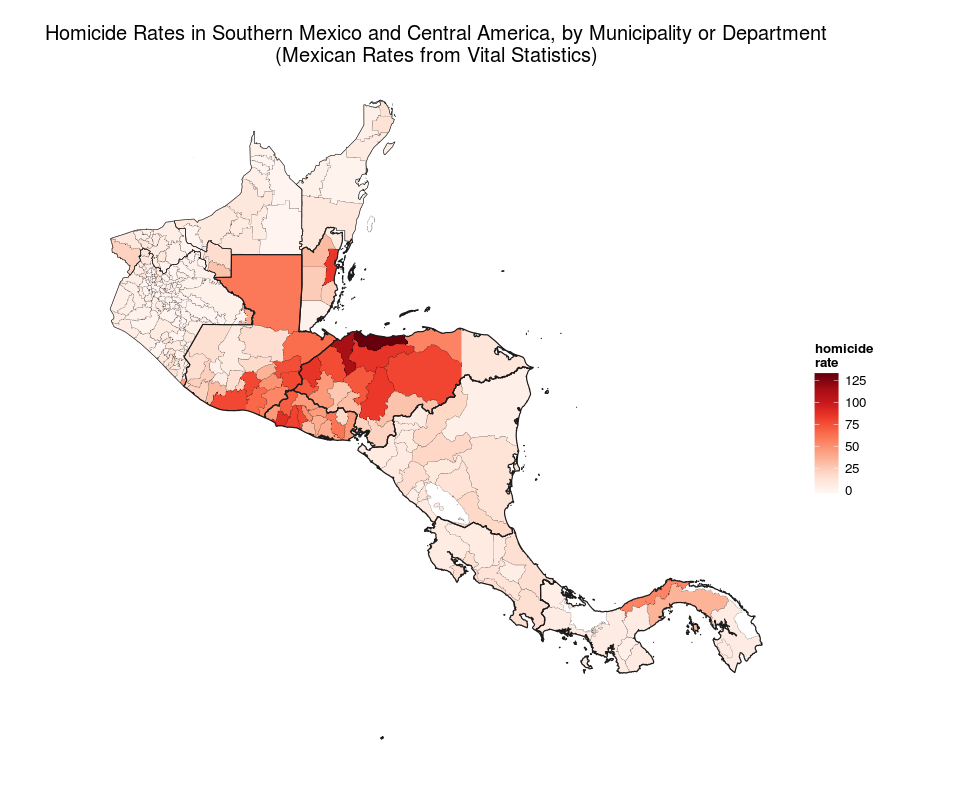 |
| Rates for Panama and Nicaragua are from 2009, all other countries 2010. Municipalities which are part of a metro area in Mexico are shown with the metro area homicide rate. |
Visit the interactive map of homicides
Having just posted on violence along Mexico’s northern border, I figured it’s time to analyze what is happing south of Mexico where some countries have experienced sharp increases in homicides.
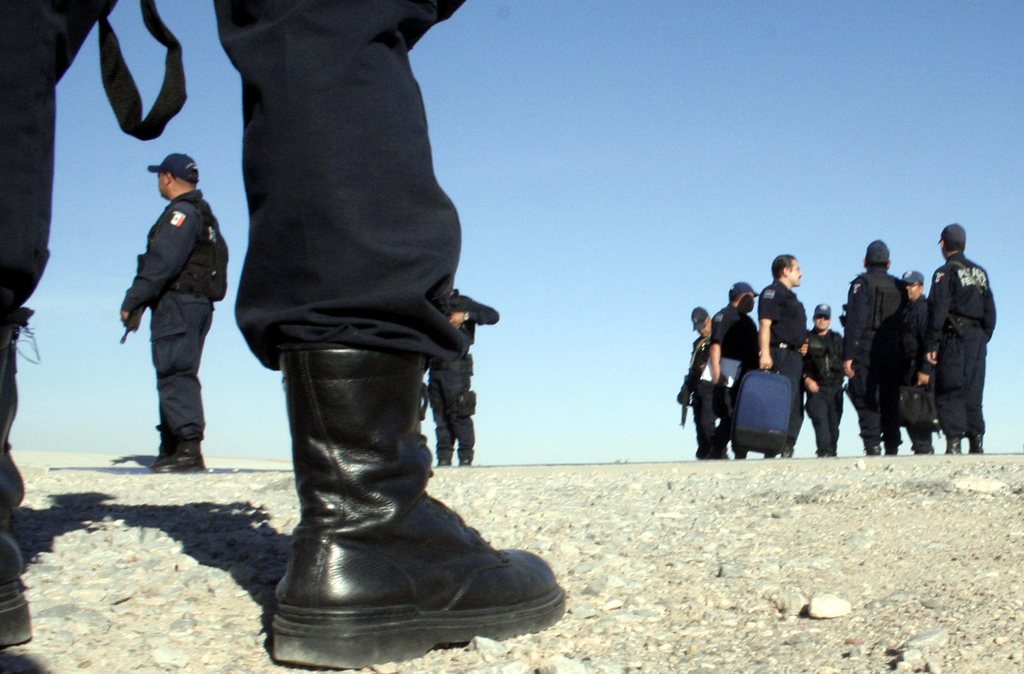 |
| Photo Credit: Jesús Villaseca Pérez |
Ever since March 2008 Ciudad Juárez began to register an alarming number of homicides becoming Mexico’s most violent city. According to the Mexican vital statistics system Ciudad Juárez (coterminous with the Juárez municipality) went from having just 202 murders in 2007 to 1,616 in 2008, 2,397 in 2009, and 3,686 in 2010.
Mexican and US officials explain the dramatic increase in violence as due to a conflict between the Sinaloa and Juárez Cartels. After a new governor was elected in October 2010 Ciudad Juárez does seem to have started turning around, but it is still an extremely violent city.
Unless otherwise stated, the content of this page is licensed under the Creative Commons Attribution 3.0 License, and code samples are licensed under the Apache 2.0 License. Privacy policy
Disclaimer: This website is not affiliated with any of the organizations or institutions to which Diego Valle-Jones belongs. All opinions are my own.
Special Projects:
Blogs I like: