
Check out the interactive poll of polls I made.
P.S. There is a poll ban starting tomorrow so I’ll restrict access to the interactive chart to people outside Mexico.
Tag: javascript | Atom Feed

This is an interactive map of all rural AGEBs that contain no localities and thus are empty of permanent residents. If you compare it to the US version, the total area with no people living inside it is much smaller since the data in Mexico is only available at the AGEB level (kind of like Census Tracts), whereas the data in the US is available at the Census Block level which are much smaller. Since there are no polygons available for rural localities, only points, I counted all rural AGEBs that contained a locality as being inhabited.
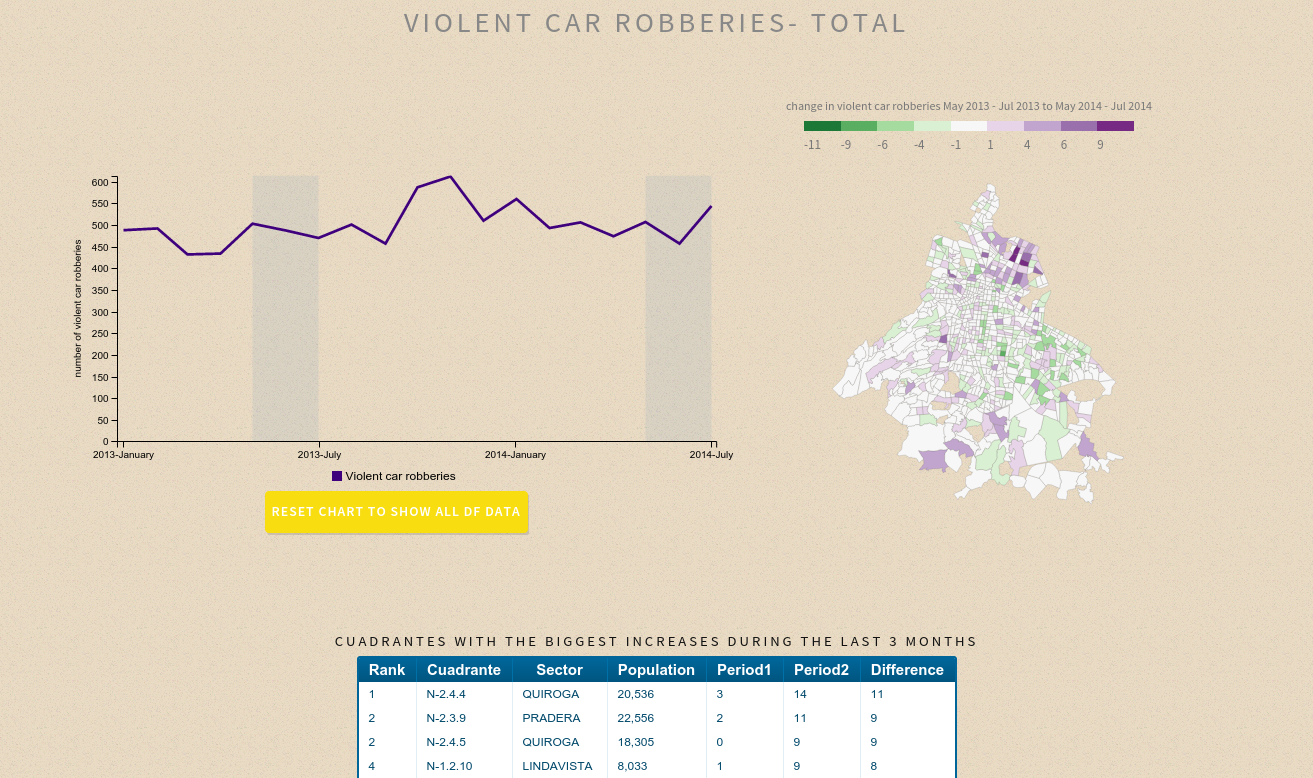
Crime information for the Federal District
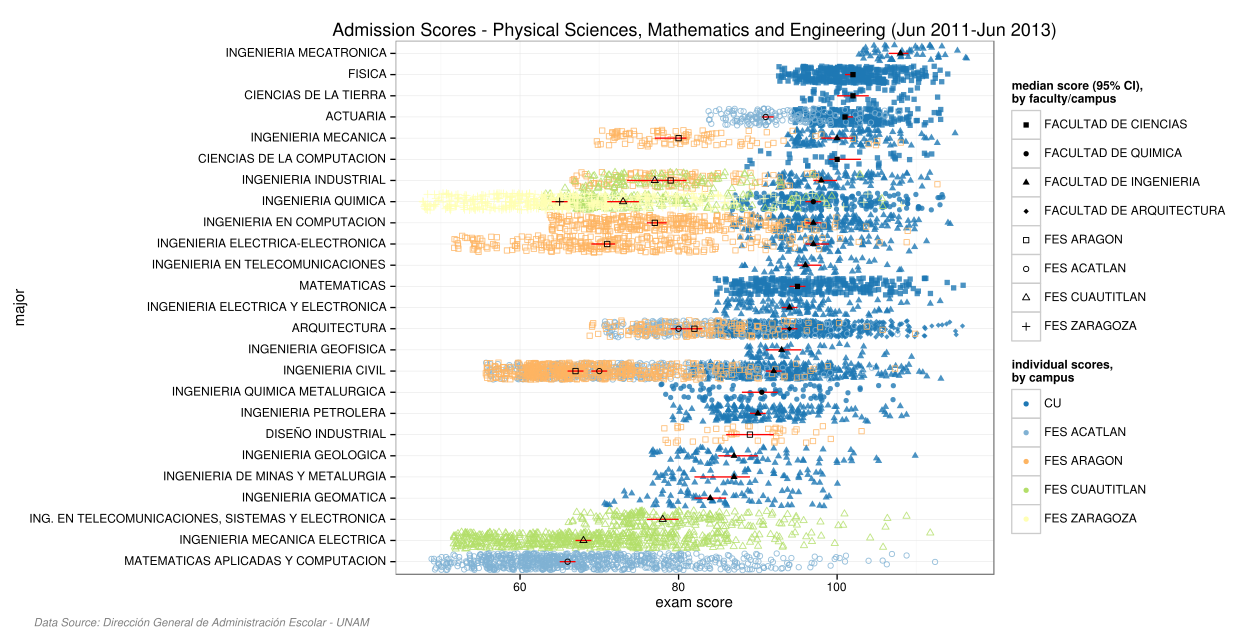
The UNAM is Mexico’s biggest and most important university. To enter it students must either take an exam or graduate from a high school run by the UNAM in less than 4 years with a grade point average of at least 70% (although some majors like medicine require 90% for pase directo). The admission exam is given twice a year, in February and June, and any student from any high school with at least a grade point average of 70% can take it. If the student meets the requirements for entering the UNAM, passing the exam guarantees him admission. The exam has 120 questions.
It’s that time of the year again when I update the interactive map of the drug war in Mexico. The map now uses 30 day months to calculate homicide rates and the new CONAPO population estimates. As usual there is also a Spanish version. All deaths registered without a date of occurrence were assumed to have occurred in the same month they were registered and all deaths without a municipio of occurrence were assumed to have taken place where they were registered. Various events are worth checking out:
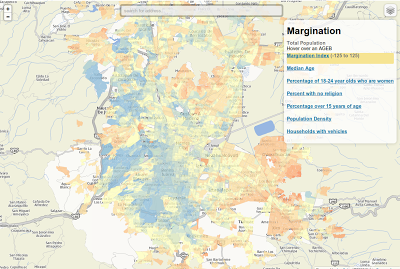
Just some maps of the Mexico City metro area based on the 2010 census. You can search by address and switch to satellite view. If the maps seem slow I suggest you use chrome.
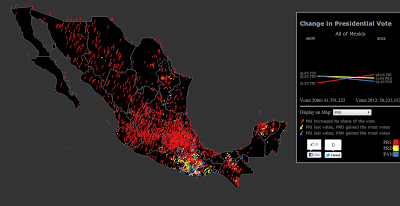 |
| Click on the image to visit the interactive version (Spanish) |
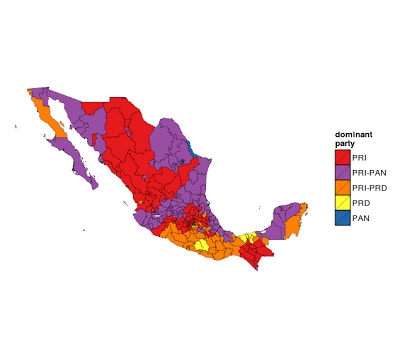
I liked this visualization by the New York Times of the US presidential election so much I decided to recreate it using Mexican data, and in the process added a slope graph. So go visit my new visualization of the change in presidential vote from 2006 to 2012 at the municipality level. I recommend using chrome to view the visualisation, there’s also a Spanish version.
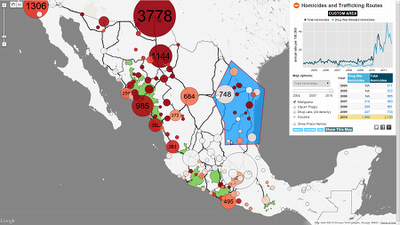 |
| Click on the image to visit the interactive drug war map. Or try the Spanish version |
If you’re interested at all in what’s happening in Mexico you can’t miss the interactive map of the drug war I just made. You can link directly to cities or whole regions within Mexico and post them to Twitter and Facebook by clicking on the “Share This Map” link at the bottom of the box. You can even compare 2007 México with 2010 México and switch between drug war-related homicides and total homicides (the ones from the INEGI). If you hover over the chart you’ll get the monthly values and information on important events. To top it off you can export the monthly data to csv. You’ll need a latest generation browser to use it.
Unless otherwise stated, the content of this page is licensed under the Creative Commons Attribution 3.0 License, and code samples are licensed under the Apache 2.0 License. Privacy policy
Disclaimer: This website is not affiliated with any of the organizations or institutions to which Diego Valle-Jones belongs. All opinions are my own.
Special Projects:
Blogs I like: