A standard topic in Operations Research is the management of queues. The standard queuing models assume random arrivals according to a Poisson process with constant rate. Or equivalently, interarrival times are said to be independent and to follow an exponential distribution with mean 1/lambda.
It is easy to see that the time between arrivals is exponential distributed (each bar is half as tall as the one preceding it), with the exception of the last bar because of the closing time. For simplicity I will ignore this. Since the times between arrivals are exponentially distributed, the number of arrivals within a fixed period should follow a Poisson distribution.
I modeled the number of individuals arriving at the billiard as a Poisson distribution. The suitability of an exponential fit to the 39 customer intervarrivals can be demonstrated in many ways. For example, a property of the exponential distribution is that its mean equals its standard deviation. These two statistics were found to be respectively 34 and 28 minutes. The slight difference is due to the fact that the billiard closes at 12:00AM (I’m too lazy to do a chi-square goodness of fit test).
Exact confidence intervals for the crude rate of arrival can be constructed using a simple formula (which since Google Docs doesn’t have the chi-square function is unavailable online) that relates the chi-square and Poisson distributions.
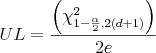
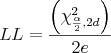

Where LL and UL are lower and upper confidence limits respectively for the SMR, χ² ν,α is the (100*α)th chi-square centile with ν degrees of freedom, d is the number of observed deaths, e is the number of expected deaths, ni is the person-time for the ith study group stratum and Ri is the reference population rate for the ith stratum.
Once we have the confidence intervals it is easy to calculate the total number of customers that the billiard can expect, and with some simple assumptions about the rental rate and the total profits of the billiard, we can investigated the money laundering hypothesis further, which I shall do in another post.
† I changed some of the data, cause you know, I don’t want to wake up headless and with burns marks all over my body.
‡ This post, of course, is meant as a joke
Bibliography:
Calculating Poisson confidence Intervals in Excel [PDF]