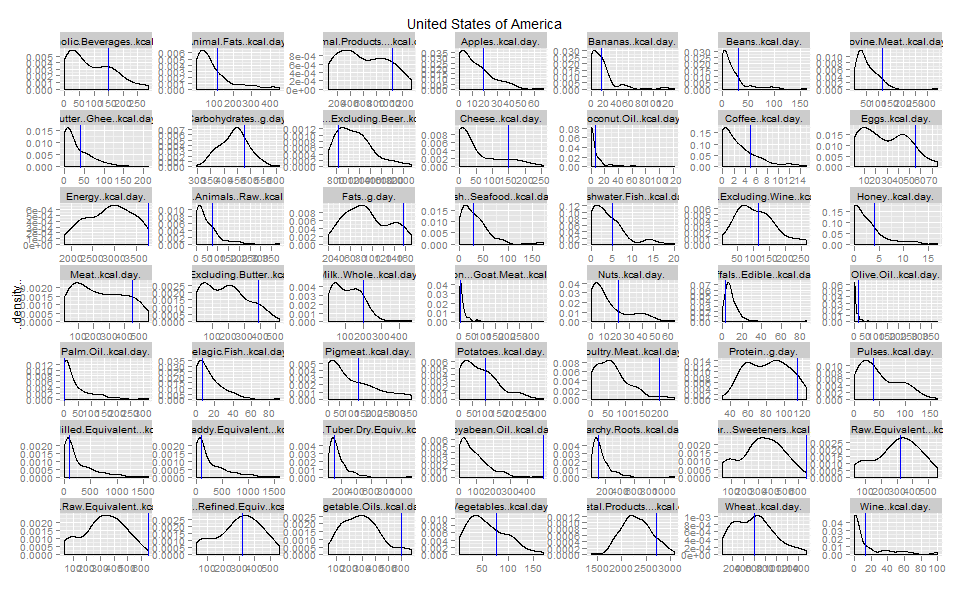
Using this
database of food consumption data the blog
Canibais e Reis kindly put together, I calculated all values for which the
US was at least 2 standard deviations from the world average.
Here are the outliers in standard deviations from the world mean:
| Poultry.Meat..kcal.day…2003 | 2.5 |
| Soybean.Oil..kcal.day…2003 | 4.5 |
| Sugar…Sweeteners..kcal.day…2003 | 2.1 |
| Sugar..Raw.Equivalent..kcal.day…2003 | 2.1 |
| Vegetable.Oils..kcal.day…2003 | 2.1 |
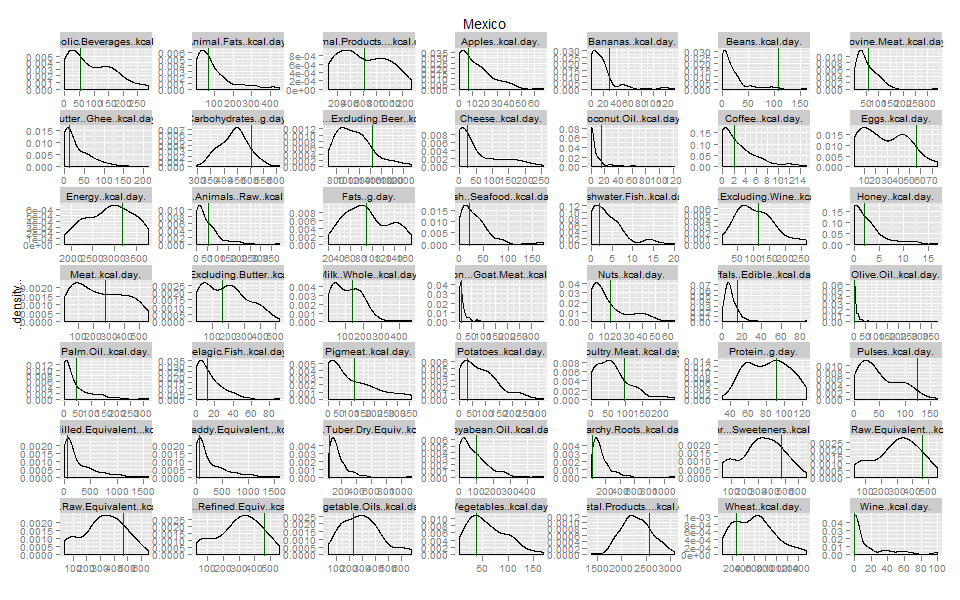
In case you were wondering, the only weird dietary habit in Mexico is (ahem) a high
consumption of beans, 3 standard deviations above the world average. Since I suspected maize was also an outlier but it wasn’t included in the database, I downloaded the 2005 data from the
FAO website and indeed, Mexico is also an outlier in maize consumption. I bet if soft drink consumption were tracked, Mexico would also be an outlier.