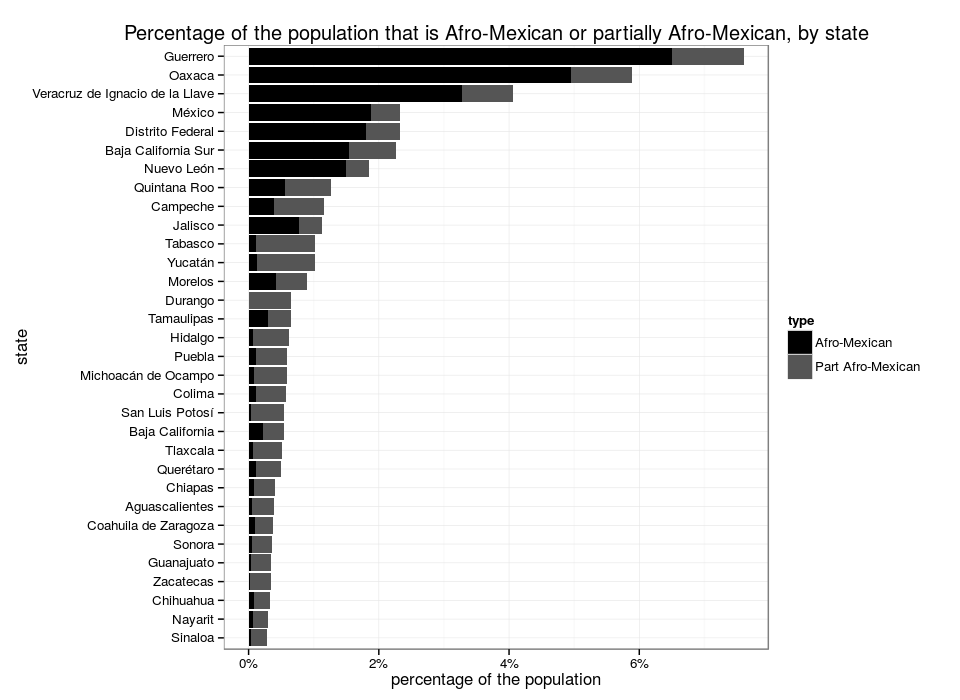
The 2015 population survey marked the first time since the 19th century that the Mexican government included a distinct category for people of Afro-Mexican descent. As of 2015, the INEGI found that 1,973,555 persons or 1.7% of the population self-identified as Afro-Mexican or partially Afro-Mexican (1.2% of the population excluding people who self-identified as only partially Afro-Mexican).

Click to visit the interactive version
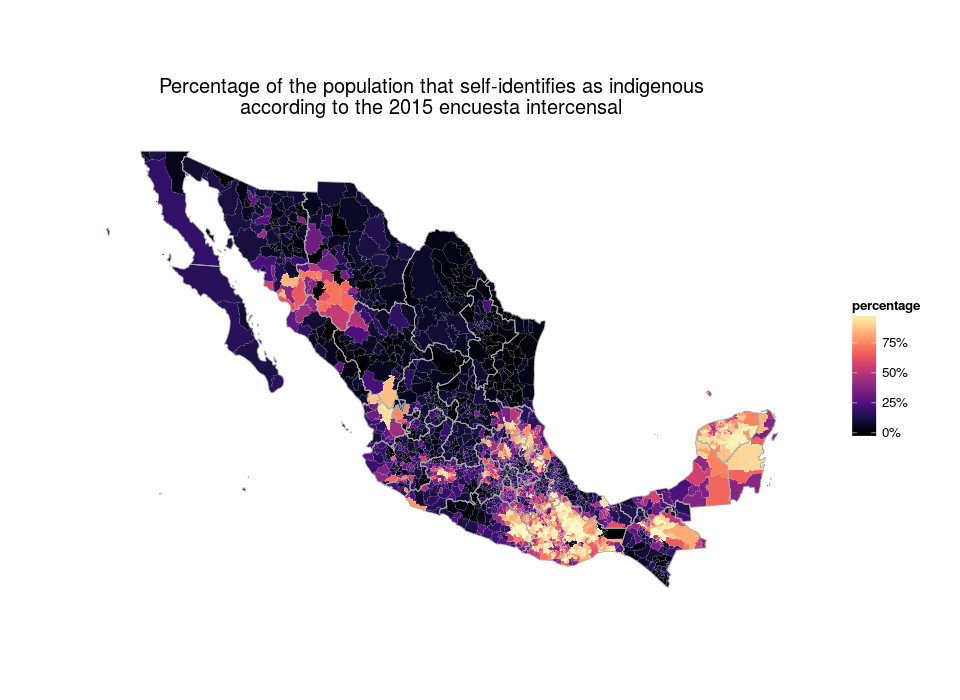
A map of the percentage of the population that self-identifies as Afro-Mexican at the municipio level shows that they tend to live in the Costa Chica of Guerrero and Oaxaca, and the state of Veracruz. This is no surprise since the isolated mountainous geography of the Costa Chica served to keep Afro-Mexican communities separate from the rest of Mexico.
Click to visit the interactive version
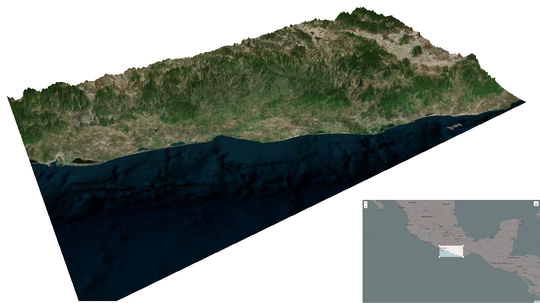
This 3D terrain map of the Costa Chica from Acapulco to Huatulco zooms in on the area with the highest percentage of Afro-Mexicans and shows how it is surrounded by mountains. The prevailing theory of how Afro-Mexicans arrived in the Costa Chica is that escaped slaves brought by Spanish galleons settled here, and found freedom and refuge thanks to the area’s isolation.
One problem with using self-identification to determine ethnic origin —as the population survey did— is that there have now been many genetic studies of Mexican populations and a robust finding is that the vast majority of Mexicans are part Black. Here’s an image of several individuals from different Mexican states taken from The genetics of Mexico recapitulates Native American substructure and affects biomedical traits
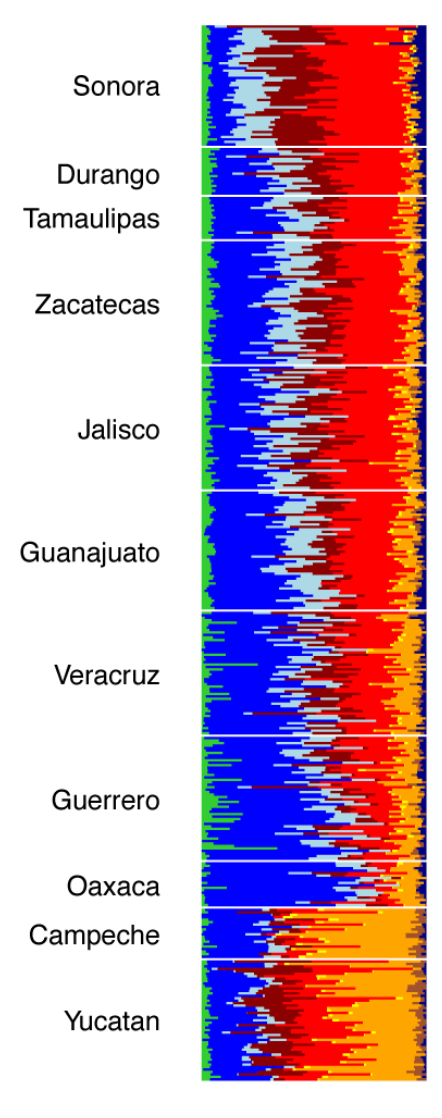
The red bars represent European ancestry, the green bars Sub-Saharan African (Yoruba), and the blue bars indigenous ancestry. Granted, genetics is a fast changing field1, but the results shouldn’t change much, and you can clearly see how just about everyone in Mexico has some very minor SSA ancestry, with a low variance, except for the states of Guerrero, Veracruz and Oaxaca where there were individuals with high African admixture. Also, note how those individuals have a high percentage of indigenous ancestry.
More than 200,000 slaves were brought to Mexico, compared to 450,000 in the US, and 4.5 million in Brazil. In the 1742 and 1793 censuses, the Black and Mulatto population of Mexico came in at about 10%, being much less numerous than the indigenous and mestizo population, and with no strictures against intermarriage, with time they were absorbed into the general Mexican population.
| Census Year | 1570 | 1646 | 1742 | 1793 |
|---|---|---|---|---|
| Indians | 3,336,860 (98.7%) | 1,269,607 (74.1%) | 1,540,256 (62.2%) | 2,319,741 (61.1%) |
| Europeans | 6,644 (0.2%) | 13,780 (0.8%) | 9,814 (0.4%) | 7,904 (0.2%) |
| Mestizos | 1,3504 (0.4%) | 277,610 (16.2%) | 640,880 (25.9%) | 1,096,026 (28.8%) |
| Blacks | 20,569 (0.6%) | 35,089 (2%) | 20,131 (0.8%) | 6,100 (0.2%) |
| Mulattos | 2,435 (0.1%) | 116,529 (6.8%) | 266,196 (10.7%) | 369,790 (9.7%) |
Source: The History of Mexico From Pre-Conquest to Present
Looking at the table, a big part of the recovery of the Indian population during the colonial period must have been due to Indian women having children with Mestizos and Mulattos, and with the forging of Mexico’s mestizo identity, the ‘afromestizos’ were simply forgotten.
The states with large populations of Afro-Mexicans are also states with large indigenous populations as the following map shows:
Some Native Mexicans also present SSA admixture. If you squint really hard at the SSA admixture for the Mayan Native Mexicans in the chart below you can see that they have some African ancestry. In the 1789 census, 12% of the population in Yucatán was Black or Mulatto. And today there are several municipios in Yucatan that have a high Afro-Mexican or part Afro-Mexican presence (wether you consider yourself Afro-Mexican or part Afro-Mexican seems to vary somewhat by state): Dzoncauich (17.5%), Mama (5.2%) and Chikindzonot (5.1%).
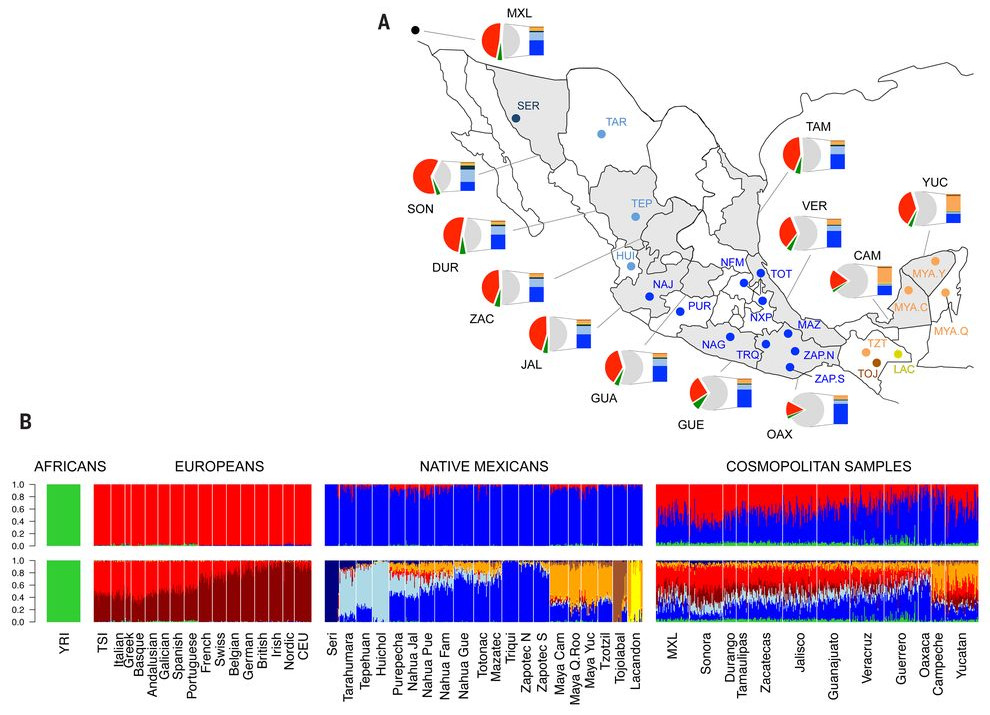
Source: The genetics of Mexico recapitulates Native American substructure and affects biomedical traits
I tried to find a genetic study that focused specifically on Afro-Mexicans, but I couldn’t find one. My best guess is that one would find much higher SSA ancestry among self-identified Afro-Mexicans, but with a large variance, unlike the rest of Mexico which consistently shows low variance.
Indigenous and Afro-Mexican are not exclusive categories. People who consider themselves both Afro-Mexican and indigenous outnumber those who consider themselves to be solely Afro-Mexican.

This tendency to belong to more than one group could bias some measurements. If you want to predict literacy in Guerrero and Veracruz it seems to be more important to be indigenous than to be Afro-Mexican.
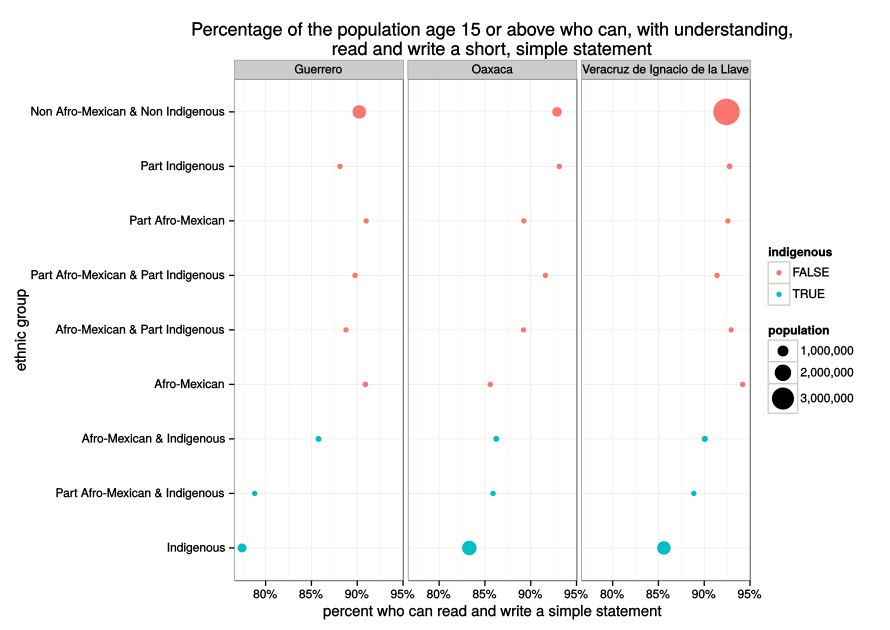
In fact, people who consider themselves to be only Afro-Mexican have the highest literacy rates in Veracruz and second highest in Guerrero, while in Oaxaca, for some reason, they cluster with the indigenous population. This certainly merits further research. When comparing literacy rates to the Mexican average, keep in mind that the three states with the highest proportion of Afro-Mexicans together with Chiapas have the lowest rates of literacy in Mexico.
In Brazil and the United States the Black population suffers from much higher rates of violence, but in Mexico the percentage of the population that is Black is not correlated with the homicide rate in Veracruz, is positively correlated in Oaxaca, and the correlation is actually negative in Guerrero. Though, that is mostly because drug trafficking routes don’t go through the areas Afro-Mexicans live in and there has been some spillover of violence into Oaxaca from Guerrero (Mexico’s most violent state). Even if less violent than the rest of Guerrero, the Costa Chica region is still very violent by any standard.

Before the drug war, there was no correlation between the percentage of the population that is Afro-Mexican and the homicide rate.

Municipios with the highest percentage of Afro-Mexicans
| State | Municipio | Total Population | Afro-Mexicans (totally or partially) | Percent |
|---|---|---|---|---|
| Oaxaca | Santiago Tapextla | 3208 | 2756 | 85.9% |
| Oaxaca | Santo Domingo Armenta | 3469 | 2678 | 77.2% |
| Oaxaca | San Juan Bautista Lo de Soto | 2593 | 1920 | 74% |
| Guerrero | Cuajinicuilapa | 27266 | 16907 | 62% |
| Oaxaca | Santa María Cortijo | 1075 | 660 | 61.4% |
| Oaxaca | Santiago Llano Grande | 3284 | 1934 | 58.9% |
| Oaxaca | Santa María Huazolotitlán | 11400 | 6201 | 54.4% |
| Oaxaca | Magdalena Mixtepec | 1375 | 742 | 54% |
| Oaxaca | Villa de Tututepec de Melchor Ocampo | 46152 | 20669 | 44.8% |
| Veracruz de Ignacio de la Llave | Xoxocotla | 5446 | 2312 | 42.5% |
Municipios with the largest population of Afro-Mexicans
| State | Municipio | Total Population | Afro-Mexicans (totally or partially) | Percent |
|---|---|---|---|---|
| Guerrero | Acapulco de Juárez | 810669 | 86157 | 10.6% |
| México | Ecatepec de Morelos | 1677678 | 37638 | 2.2% |
| Distrito Federal | Iztapalapa | 1827868 | 34239 | 1.9% |
| Nuevo León | General Escobedo | 425148 | 33849 | 8% |
| Veracruz de Ignacio de la Llave | Veracruz | 609964 | 30688 | 5% |
| México | Chimalhuacán | 679811 | 30190 | 4.4% |
| Jalisco | Guadalajara | 1460148 | 26018 | 1.8% |
| Jalisco | Zapopan | 1332272 | 22275 | 1.7% |
| Distrito Federal | Coyoacán | 608479 | 21101 | 3.5% |
| Distrito Federal | Álvaro Obregón | 749982 | 20806 | 2.8% |
P.S. Source Code