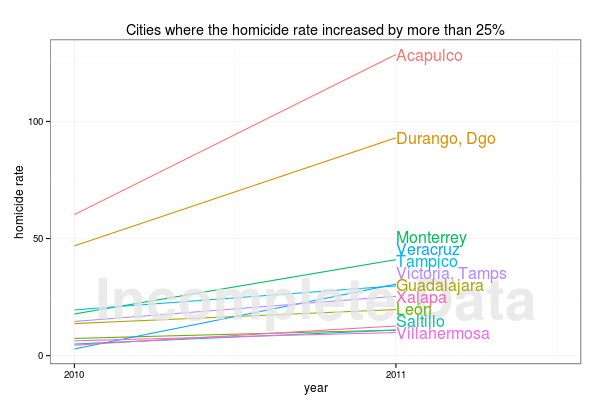
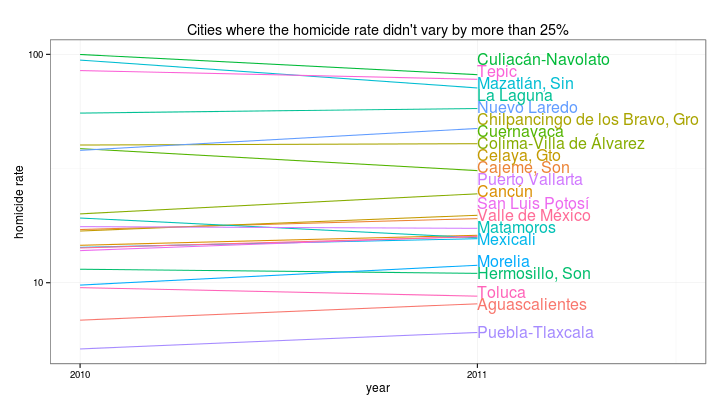
|
| Note the log scale and that data are incomplete |
As I previously wrote there have been a lot deaths of unknown intent with characteristics similar to homicides since the drug war started, and 2011 was no exception: Coahuila went from registering 2 deaths of unknown intent in 2009 to 216 in 2011, Veracruz went from 197 to 747, Chiapas went from 2 to 614, Tamaulipas had 195 in 2011, and Mexico as a whole went from registering 2,376 deaths of unknown intent in 2007 to 5,630 in 2011.
We can also compare the number of homicides to the number of deaths in the recently cancelled drug war-related homicide database (only including the first 9 moths of 2011) to find out which states had more drug war deaths than total homicides, which in theory should be impossible
| State | Year | Drug War- Related Homicides | Homicides |
|---|---|---|---|
| Coahuila | 2011 | 572 | 478 |
| Sinaloa | 2007 | 414 | 388 |
| Sinaloa | 2008 | 1084 | 871 |
| Tamaulipas | 2010 | 1209 | 1011 |
| Tamaulipas | 2011 | 1108 | 830 |
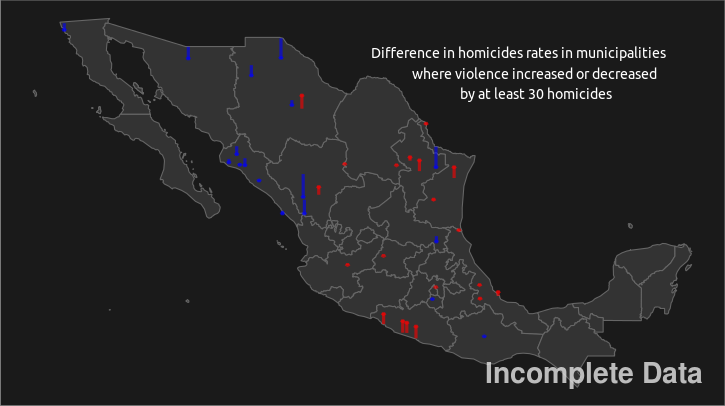
One can also look at the data disaggregated by metro area or municipality (only showing those cities where drug war-related homicides exceeded all homicides by at least 15)
| City | Year | Drug War- Related Homicides | Homicides |
|---|---|---|---|
| Culiacán-Navolato | 2008 | 654 | 460 |
| Culiacán-Navolato | 2007 | 271 | 131 |
| San Fernando, Tamps | 2011 | 292 | 159 |
| La Laguna | 2011 | 633 | 509 |
| Veracruz | 2011 | 261 | 164 |
| Valle Hermoso, Tamps | 2011 | 95 | 14 |
| Reynosa | 2010 | 154 | 92 |
| Miguel Alemán, Tamps | 2010 | 110 | 58 |
| Mier, Tamps | 2010 | 93 | 42 |
| Guerrero, Tamps | 2010 | 45 | 0 |
| San Fernando, Tamps | 2010 | 169 | 130 |
| Taxco de Alarcón, Gro | 2010 | 75 | 38 |
| La Laguna | 2010 | 704 | 673 |
| Mier, Tamps | 2011 | 50 | 19 |
| Morelia | 2011 | 104 | 78 |
| Ahumada, Chih | 2009 | 27 | 4 |
| Guerrero, Tamps | 2011 | 35 | 12 |
| Gustavo Díaz Ordaz, Tamps | 2010 | 25 | 7 |
| Jiménez, Chih | 2011 | 47 | 30 |
| Cosalá, Sin | 2011 | 25 | 8 |
| Salvador Alvarado, Sin | 2008 | 47 | 31 |
| Camargo, Tamps | 2010 | 30 | 15 |
With so many missing deaths I’ve opted to watermark the plots with a text that says ‘incomplete data’ since I could probably get better estimates by classifying the deaths of unknown intent, but I need access to the raw data which is not available yet. In the plot at the top of the blog Tuxtla is the safest city, but with 112 deaths of unknown intent and only 10 homicides this is extremely likely to be wrong.
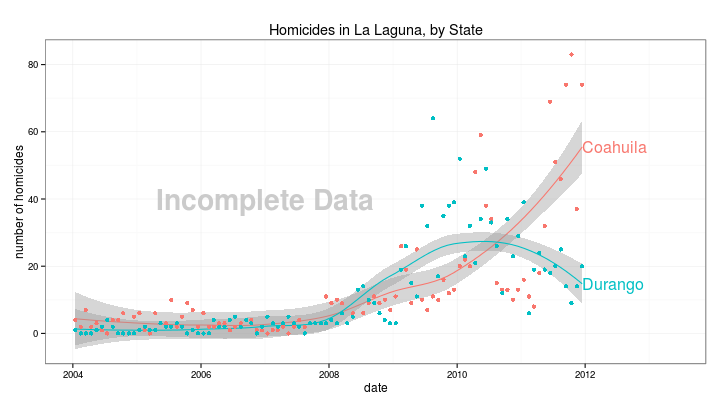
By looking at the metro area homicide numbers you can miss diverging municipality level trends, so for La Laguna and Mexico City I’ve plotted the data grouped by state.
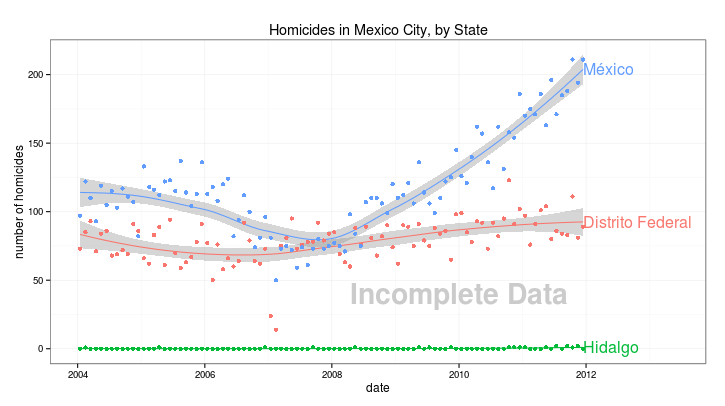 |
| The model is loess |
In La Laguna violence in the part of the city situated in Coahuila (mainly Torreón) increased while violence in the Durango part decreased (mainly Gomez Palacio)
 |
| The model is loes |