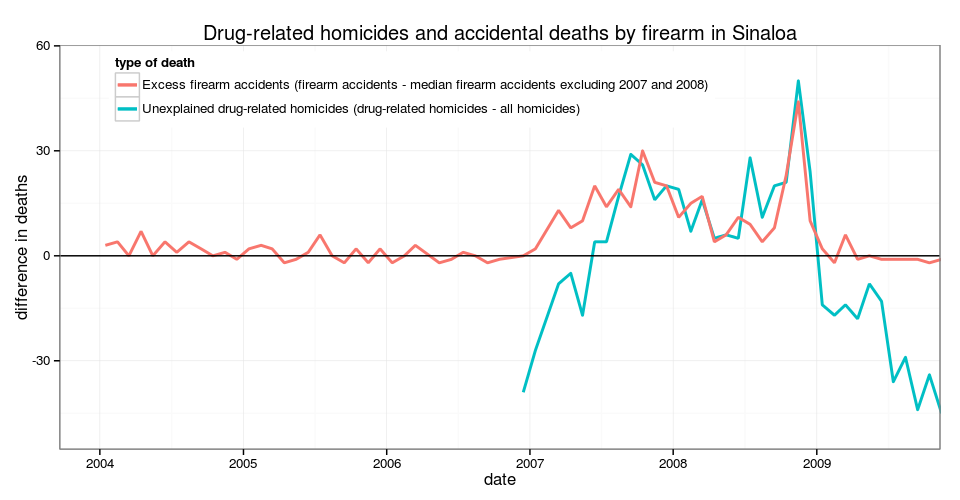
Here is a chart from my old post highlighting the monthly difference between the vital statistics data and drug war-related homicides (Dec 2006- Dec 2009):
Most homicides in Sinaloa are caused by firearms, and given the other errors in the mortality database it seems one should look if the discrepancy in the numbers lie in an excess of firearm deaths.
Here’s a table of the yearly vital statistics data on homicides, firearm accidents and drug war-related homicides:
| Year | All Homicides | Drug-Related Homicides | Accidental Firearm Deaths |
| 2004 | 387 | NA | 61 |
| 2005 | 450 | NA | 47 |
| 2006 | 451 | NA | 26 |
| 2007 | 387 | 426 | 204 |
| 2008 | 869 | 1,084 | 198 |
| 2009 | 1,422 | 1,059 | 36 |
| 2010 | 2,277 | 1,815 | 67† |
I highlighted the years where drug homicides exceeded all homicides. As you can see the anomalous years also had an extremely high number of firearm accidents (I used the External Cause of Injury Mortality Matrix for ICD-10 to code accidents by firearm)
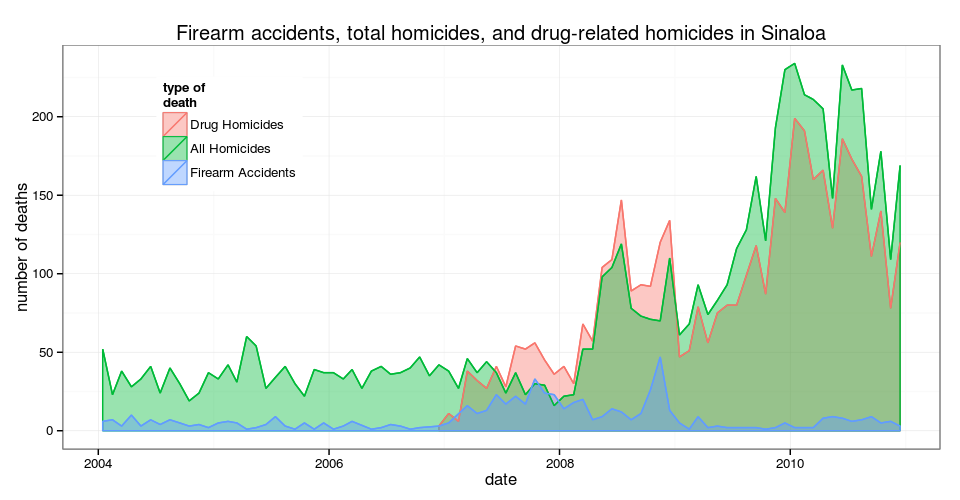
It seems natural that firearm accidents would rise along with homicides as the drug war ratcheted up, since an escalation of violence would involve hiring newer, less experienced gunmen. As you’d expect the newer gunmen were not the brightest bulbs in the box. But even for dumb cartel gunmen I’m surprised by the sudden increase in accidents and the sudden drop after 2008.
There’s also the fact that the police and government authorities are under much more pressure to bring down the number of homicides than the number of accidents. For all these reasons I think it is much more likely that at least some homicides were misclassified as accidents, and that this explains part of the discrepancy during 2007 and 2008.
As funny as I find this, it probably didn’t happen in Sinaloa in 2007 and 2008
What I’ll do to find out whether the deaths were accidents or homicides is to first ignore the classification specified in the mortality database for all firearm accidents from January 2007 to December 2008. Then use machine learning to see if the characteristics of the original firearm accidents (sex, age, place of occurrence, etc) are sufficient to separate them into homicides and accidents.
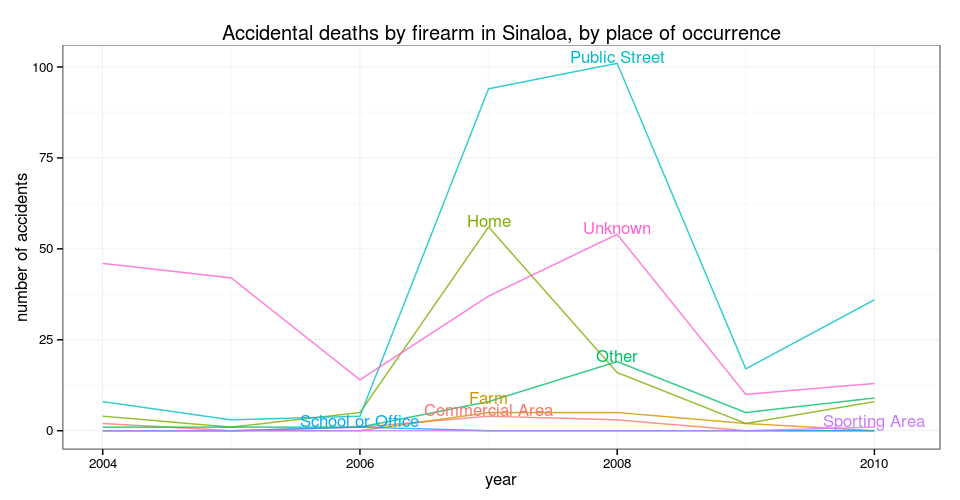
Homicides in Sinaloa tend to occur on public streets:
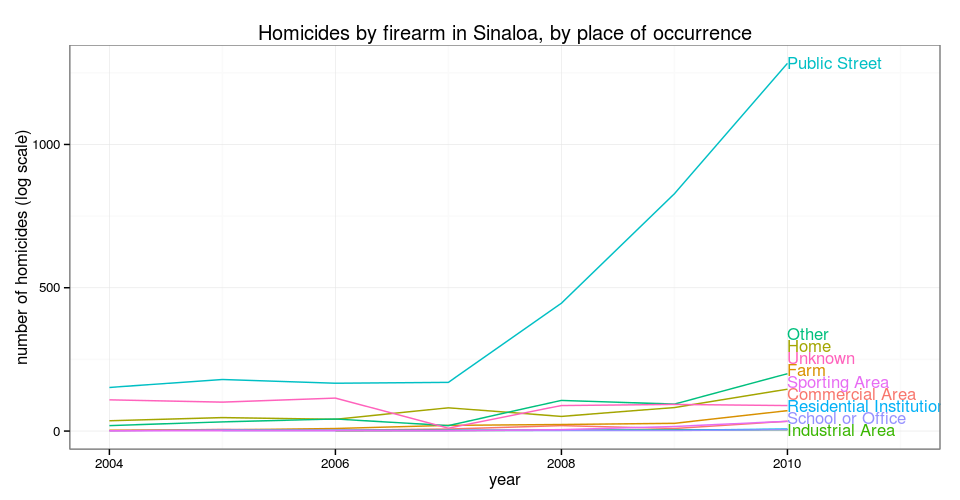
However, accidentals deaths tend to occur all over the place except for 2007 and 2008 when there were a lot accidents on public streets (surprise, surprise):
Once we ignore the firearm accidents that occurred in 2007 and 2008 there are very few accidentals deaths by firearm in Sinaloa, and since the more data the better, I used all 1,834 firearms accidents in the rest of Mexico (excluding Chiapas because its vital statistics are a mess) together with all homicides and accidents by firearm in Sinaloa (excluding 2007 and 2008 obviously) to train a classifier.
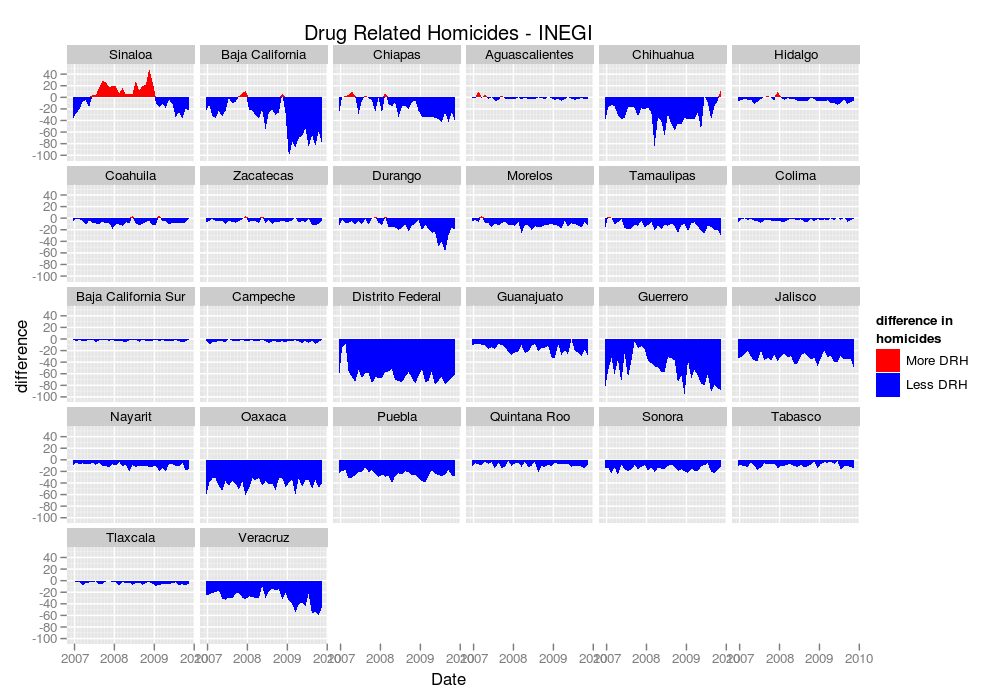
There are still some unresolved problems with this approach since the state of Baja California went from having 6 deaths by firearm in 2006, to 100 in 2007, to 6 again in 2008, in comparison homicides went from 303 in 2006 down to 243 in 2007. This could imply that Sinaloa is not the only state with mortality misclassifications and underlines just how difficult it is to get training data (I ignored any possible errors in the rest of the country for classifying the data)
I ended up using the age, sex, place of occurrence of the injury, year of death, marital status and whether an autopsy was perfomed as the variables (including their interactions) in a penalized logistic regression to separate homicides from accidents. To avoid overfitting I separeted 30% of the data into a test dataset.
These are the results of crossvalidating on the test database:
           Reference
Prediction Accident Homicide
  Accident      193       82
  Homicide      166      933

               Accuracy : 0.8195
                 95% CI : (0.7981, 0.8395)
    No Information Rate : 0.7387
    P-Value [Acc > NIR] : 8.951e-13

                  Kappa : 0.4942
 Mcnemar's Test P-Value : 1.360e-07

            Sensitivity : 0.5376
           Specificity : 0.9192
         Pos Pred Value : 0.7018
         Neg Pred Value : 0.8490
             Prevalence : 0.2613
         Detection Rate : 0.1405
   Detection Prevalence : 0.2001

       'Positive' Class : Accident
Specificity measures the proportion of homicides which were correctly identified, which in this case is more important than misclassified accidents (sensitivity), since I’m trying to prove that the accidents are really homicides. With a specificity of 92% we can be pretty certain that a homicide classified as such is actually a homicide, but with a sensitivity of only 54% we might as well flip a coin when determining how certain we are that an accident is actually an accident. With such a low sensitivity we can consider the number of homicides in the table below as a sort of lower limit.
| Year | Imputed Intent | Number of Deaths |
| 2007 | Accident | 61 |
| 2007 | Homicide | 143 |
| 2008 | Accident | 20 |
| 2008 | Homicide | 178 |
The result of classifying the 204 and 198 firearm accidents in 2007 and 2008.
As you can see the data looks much more reasonable now, though in 2008 there were still more drug homicides than total homicides, which may have been because some homicides were registered as accidents by a cause other than firearm (in around 23% of accidents the cause is left unspecified). When it comes to violence in Mexico it seems we watch shadows projected on a cave’s wall.
Given that the sudden increase in homicides coincided with the end and start of a new year there may have been some sort of law or some legal means that made it ok to classify a homicide as an accident but that is just a matter of calling a tail a leg. But at this point I’m just speculating as to possible motives for recording a homicide as an accident, so I’ll stop.
I can’t confitm anything. There’s something to what you ask, but I can’t confirm anything. We have to perfom tests, you’ll have the data later. What we know is that it was an accident, but a very strange one because the body was dumped at the public hospital where he died.
No te puedo confirmar nada. Algo hay de lo que preguntas, pero no te puedo confirmar nada. Faltan pruebas periciales por realizar, después tendrás los datos. Lo que sabemos es que es un accidente, pero muy raro porque el cuerpo fue arrojado en el Seguro Social y ahí murióP.S. The data and code are available from my GitHub