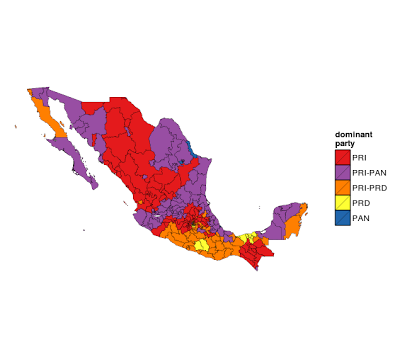
These are the median values for the percentage of the vote for each party in the clusters:
| Interpretation | Cluster | PRD | PAN | PRI |
|---|---|---|---|---|
| PRI | 1 | 0.27 | 0.20 | 0.46 |
| PRI-PAN | 2 | 0.23 | 0.34 | 0.38 |
| PRI-PRD | 3 | 0.40 | 0.16 | 0.37 |
| PRD | 4 | 0.54 | 0.15 | 0.27 |
| PAN | 5 | 0.22 | 0.48 | 0.26 |
Posted on Mon 11 February 2013
| Interpretation | Cluster | PRD | PAN | PRI |
|---|---|---|---|---|
| PRI | 1 | 0.27 | 0.20 | 0.46 |
| PRI-PAN | 2 | 0.23 | 0.34 | 0.38 |
| PRI-PRD | 3 | 0.40 | 0.16 | 0.37 |
| PRD | 4 | 0.54 | 0.15 | 0.27 |
| PAN | 5 | 0.22 | 0.48 | 0.26 |
Unless otherwise stated, the content of this page is licensed under the Creative Commons Attribution 3.0 License, and code samples are licensed under the Apache 2.0 License. Privacy policy
Disclaimer: This website is not affiliated with any of the organizations or institutions to which Diego Valle-Jones belongs. All opinions are my own.
Special Projects:
Blogs I like: