Depending on the student’s choice of major, the admission exam emphasizes one of four basic areas of study. Let’s say you want to study math: in addition to being tested on the topics every high school student is supposed to know, you’ll get a couple of extra questions about integration by parts; if you want to study biology the extra questions will be about the the Krebs cycle; if you want to study philosophy the exam will probably include extra references to the great works of literature; and if you want to study a social science you’ll be asked about the differences between a grand macchiato and a caffè latte.
 |
| Click on the chart to visit the interactive version |
Apart from UNAM’s main (and most prestigious) campus of Ciudad Universitaria (CU), the university has several satellite campuses in the Mexico City metro area as well as many others across Mexico. In this post I will only analyse those located in Mexico City, and only for the scholarized system (sistema escolarizado) where the students have to actually sit in a classroom (the UNAM also offers remote TV/Internet classes and under an open system). The admission exam to the UNAM is quite competitive and only a small percentage of those who apply actually get in.
| Date | Location | Percentage admitted | Applied | Completed Test | Admitted |
|---|---|---|---|---|---|
| 2011-06 | CU | 8.6 | 30,615 | 27,515 | 2,626 |
| 2011-06 | Not CU | 9.1 | 32,215 | 29,667 | 2,916 |
| 2012-02 | CU | 5.2 | 61,262 | 55,793 | 3,192 |
| 2012-02 | Not CU | 6.4 | 56,012 | 52,287 | 3,597 |
| 2012-06 | CU | 5.1 | 30,944 | 28,084 | 1,573 |
| 2012-06 | Not CU | 10.1 | 32,741 | 30,354 | 3,299 |
| 2013-02 | CU | 5.4 | 63,562 | 59,425 | 3,424 |
| 2013-02 | Not CU | 6.7 | 56,348 | 53,547 | 3,800 |
| 2013-06 | CU | 6.3 | 29,872 | 26,052 | 1,868 |
| 2013-06 | Not CU | 13.8 | 33,744 | 30,403 | 4,656 |
This year Harvard sent out 2,023 offers out of 34,295 applications for an admission rate of 5.9%, which is exactly the same overall admission rate as the UNAM (CU) from June 2011 to June 2013 (though, of course, Harvard has much much lower standards in who it admits).
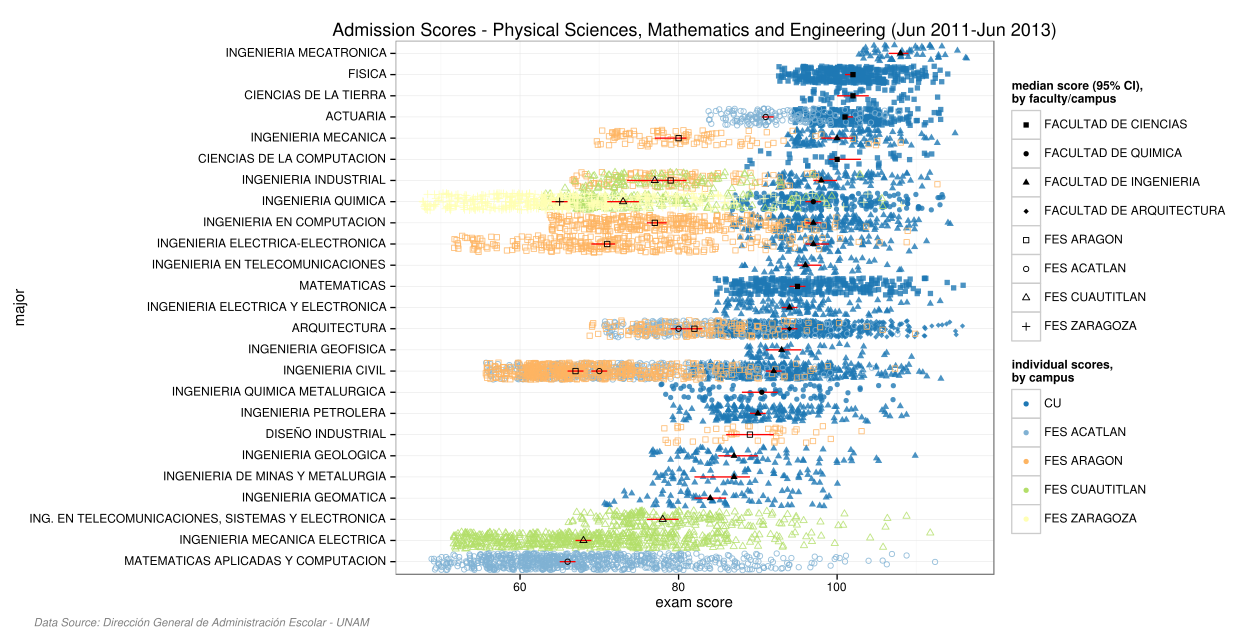
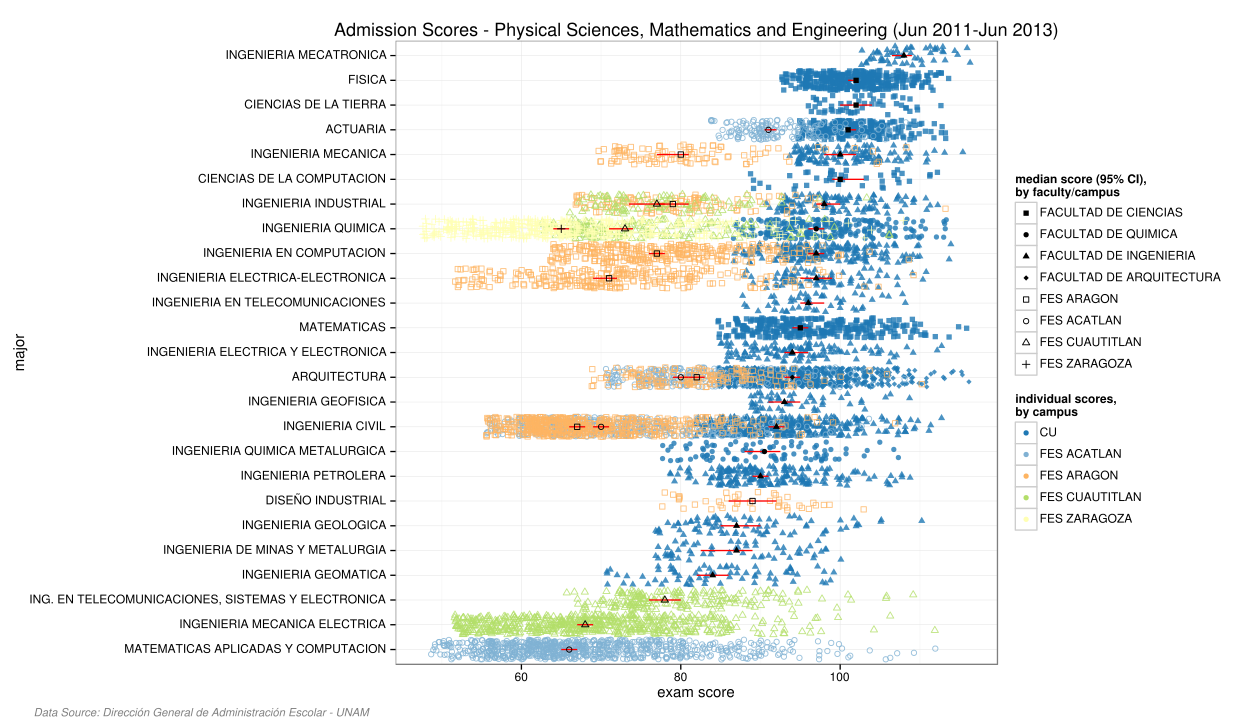
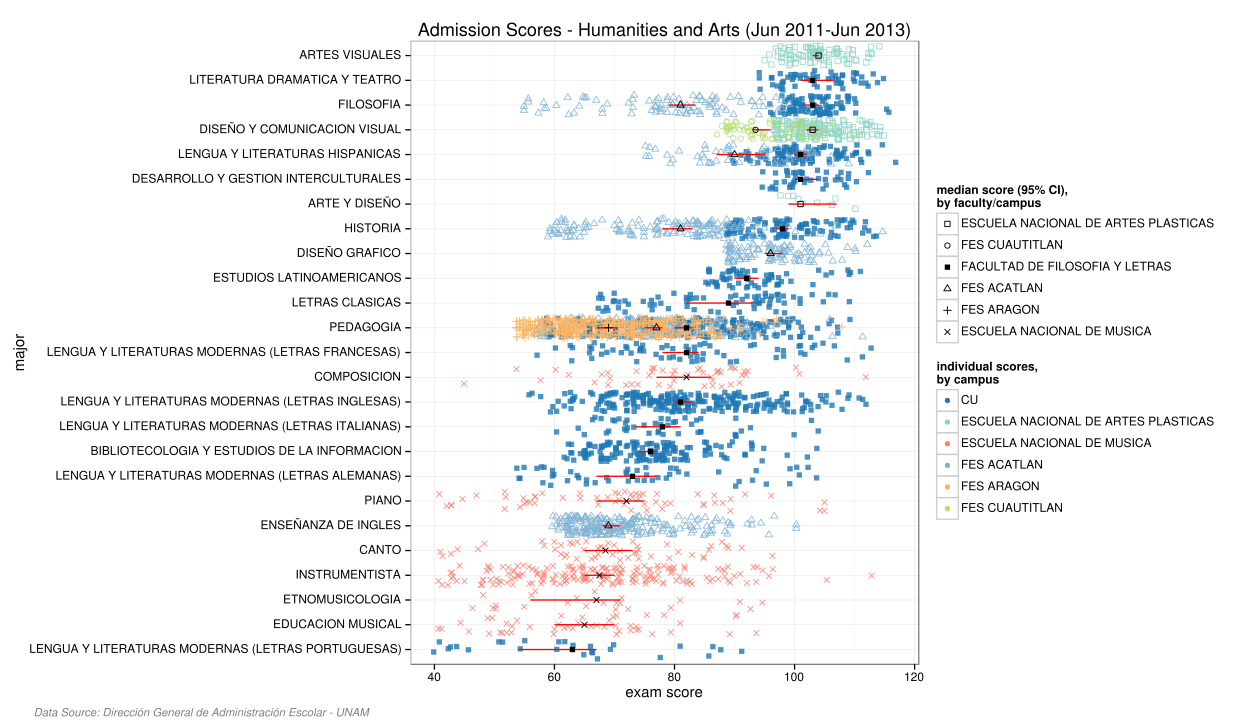
Admissions by major
 |
| Click on the chart to visit the interactive version |
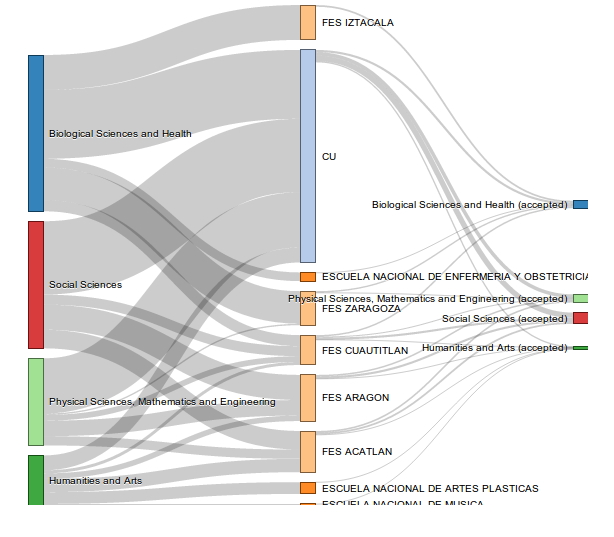
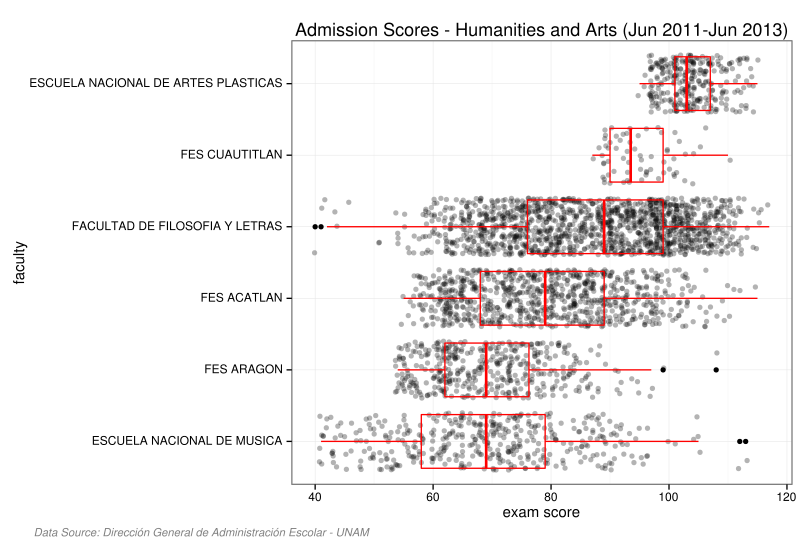
Admissions by area
 |
| Click on the chart to visit the interactive version |
I scrapped all admission results from the UNAM’s website from June 2011 to June 2013. There were some problems with the data at the UNAM’s end since the listings didn’t always match the summary statistics included in the web pages. If you visit the results for Historia del Arte you’ll see that the summary statistics claim that zero students applied to take the test, but the listing includes 3 students (given the test scores of infomatics students I’m not surprised by the mistakes). Anyways, this kind of mismatch was rare and didn’t involve that many students. I took the actual listing to be definitive. In addition the results sometimes include data from students whose result is Cita para aclarar situación escolar, I simply interpreted this as being a missing value.
Physical Sciences, Mathematics and Engineering
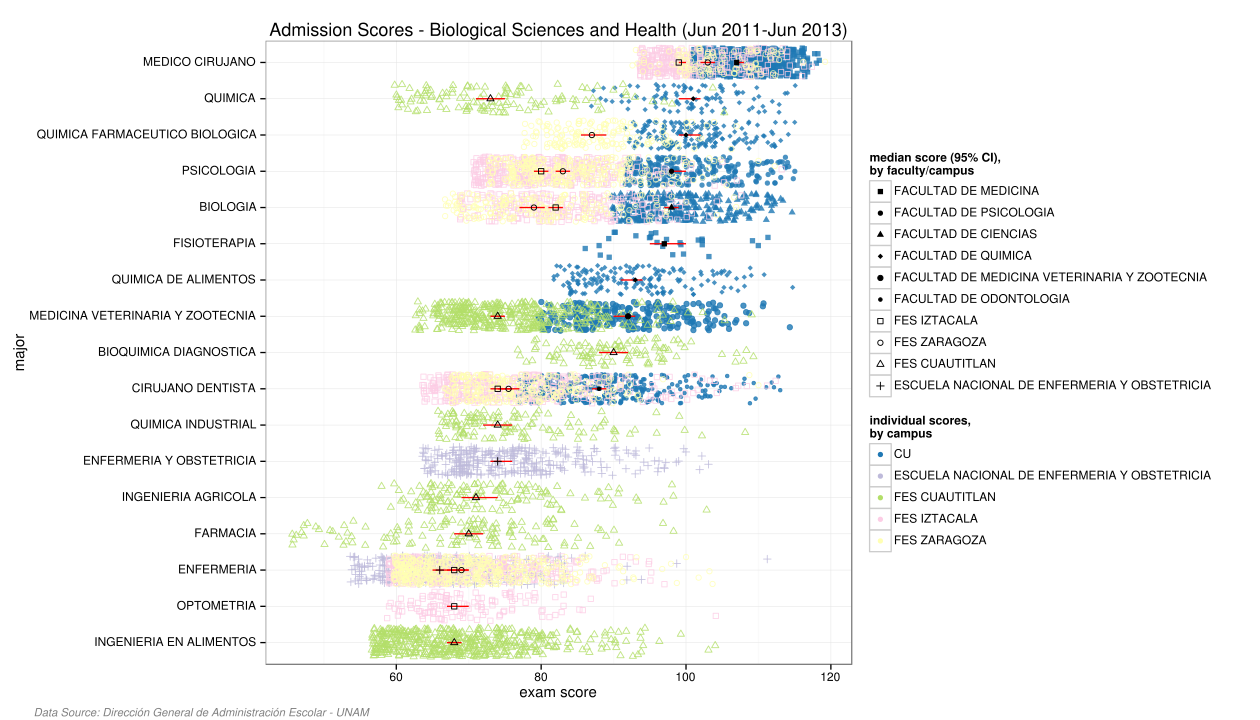
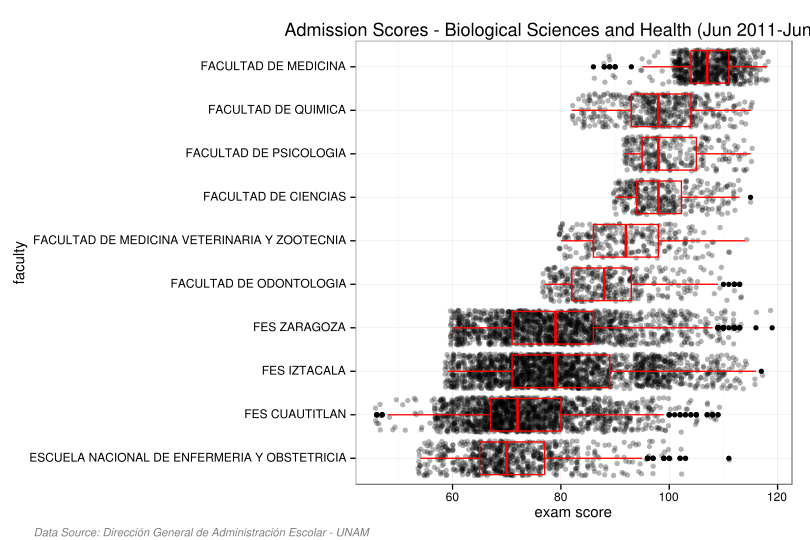
Biological Sciences and Health
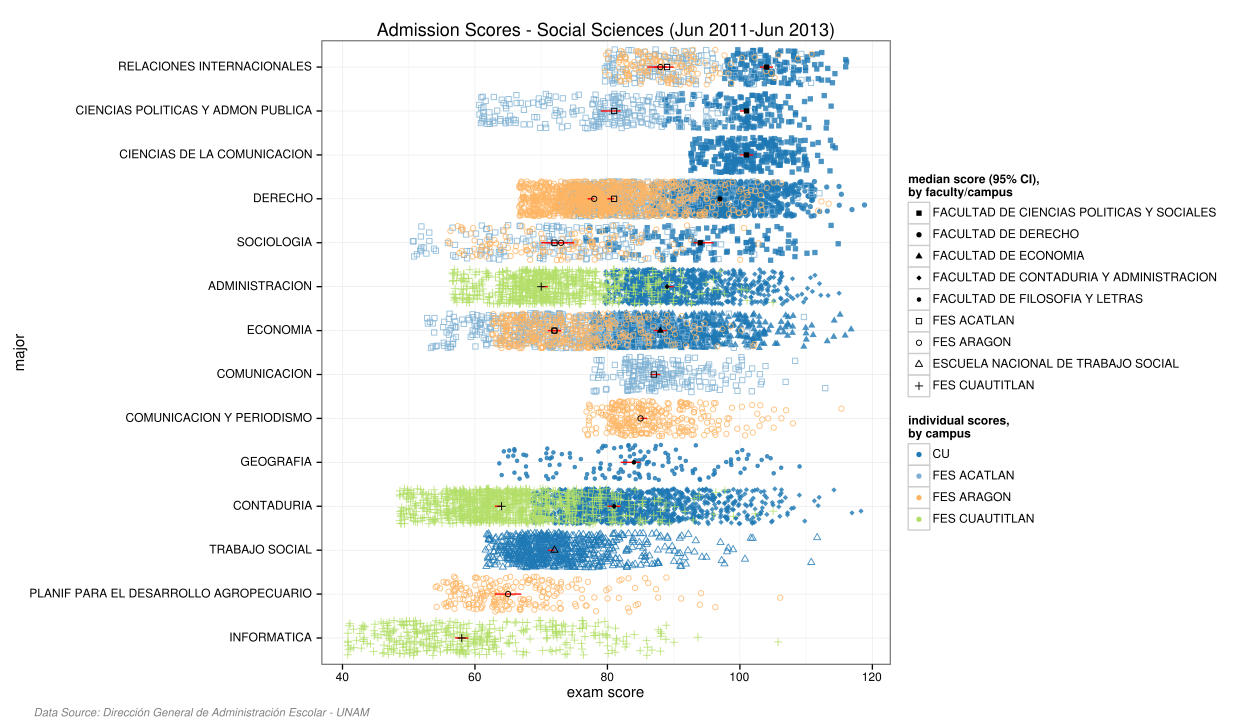
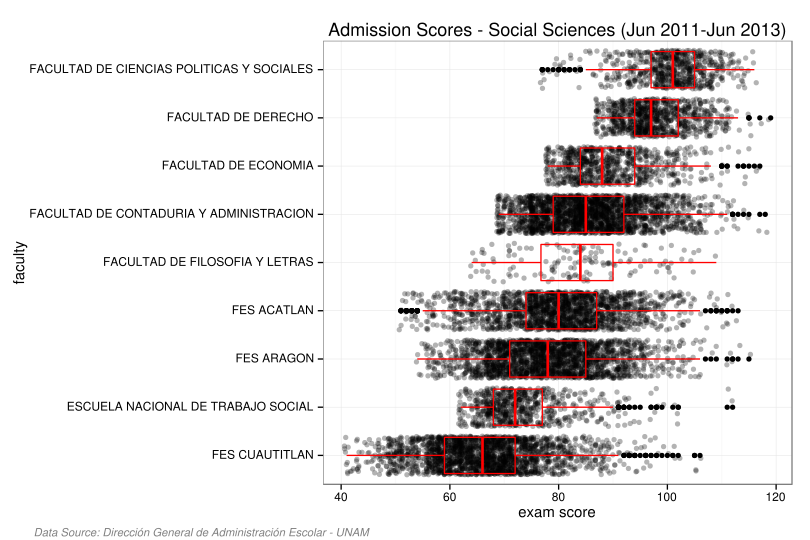
Social Sciences
Humanities and Arts
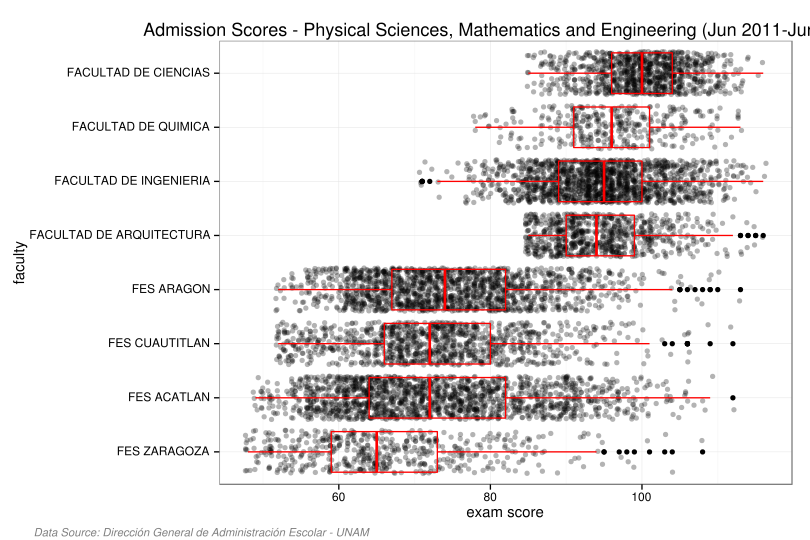
Highest scoring majors in each area

Changes in median admission scores from exam to exam (first differences)

(a standard deviation is 17 points)
One big problem with the admission process at the UNAM is that it doesn’t use Gale-Shapley and thus students have an incentive to not reveal their true preferences:
Imagine a student who is deciding between studying ingeniería mecatrónica and ingeniería mecánica, because mechatronics is very hard to get into, and students only get to apply to one major at each exam, he decides to list mechanical engineering as his choice even when there was a chance (albeit not as big) that he would have been admitted to mechatronics.
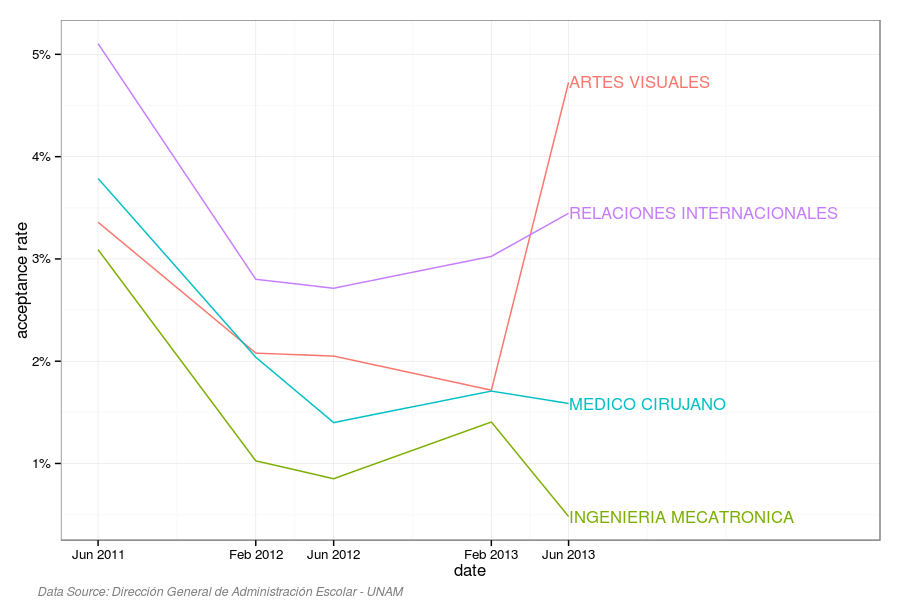
 |
| Click on the chart to visit the interactive version |
Another consequence of not using Gale-Shapley is that some students who do list their true preference are rejected in favor of lower scoring students (this is probably a really big deal).
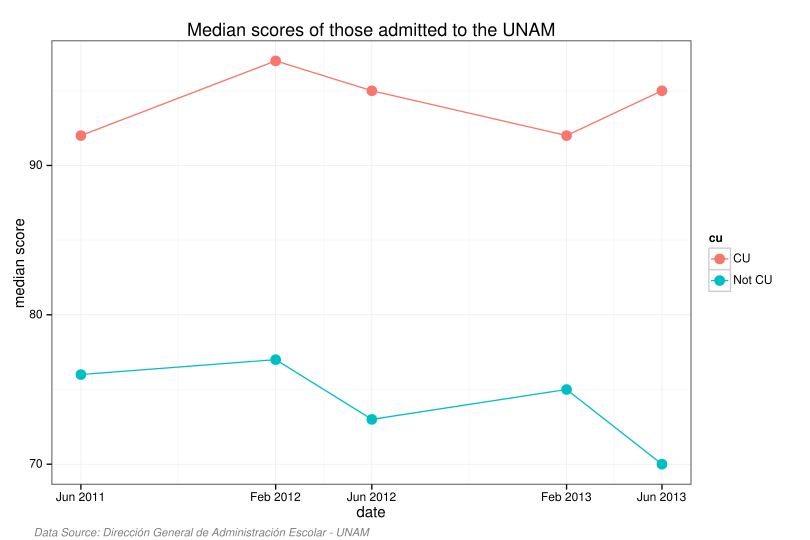
 |
| Click on the chart to visit the interactive version |

The easiest way to remedy this would be to copy the COMIPEMS exam —which the UNAM helped design— and allow students to list more than one major/campus when applying. Obviously there are a lot of variations and complications the UNAM could use to make its admission process better, for example they could start admitting students from different areas than their first choice major if they had really high test scores. I’m sure the
There’s also a positive correlation between average test scores and the starting salaries of university graduates (of any university in Mexico City, not just the UNAM) in a poll conducted by Reforma in Mexico City.

P.S. I bet the Escuela Nacional de Artes Plásticas is full of rich kids
P.P.S. Visit the companion website full of interactive charts
P.P.P.S. Source code