https://hoyodecrimen.com/en/ - English version
https://hoyodecrimen.com/ - Spanish version
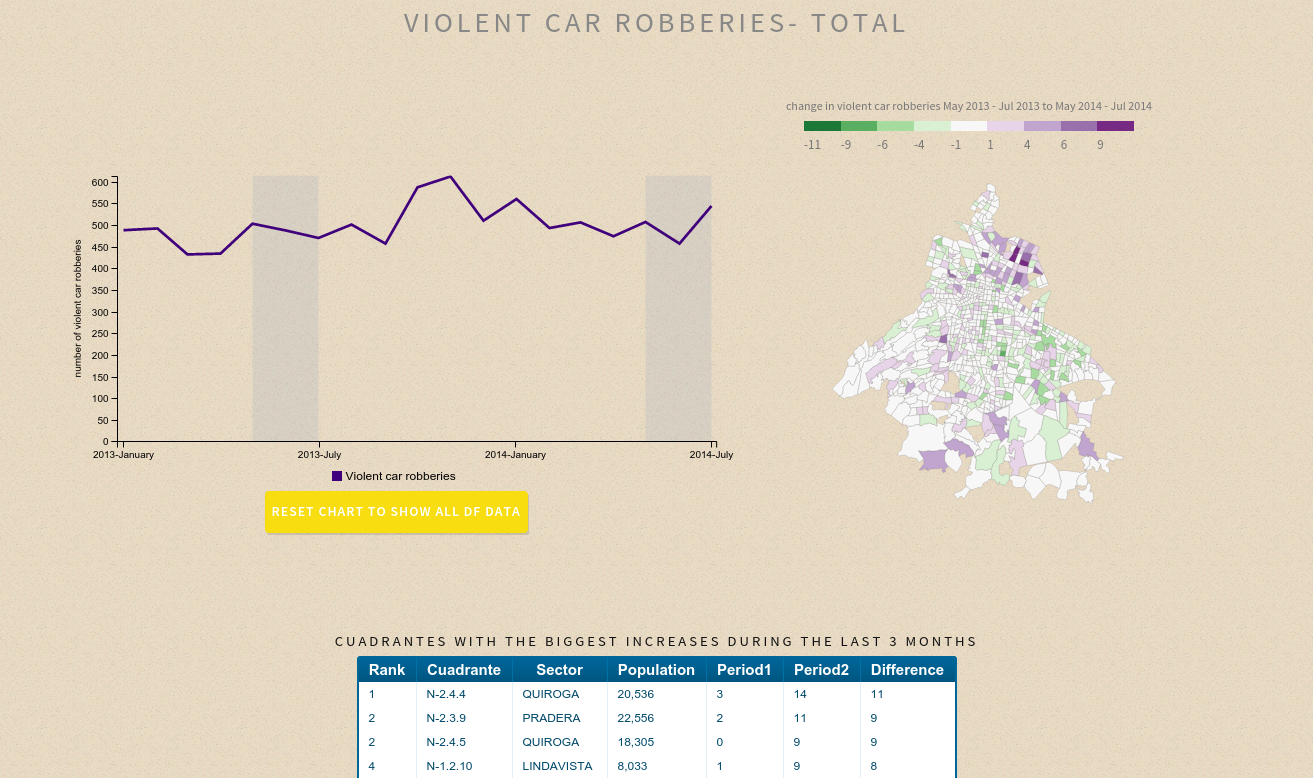
I’ve also added a trends section where you can look up which cuadrantes experienced a rise in crime
 |
| There seems to a be big problem with car robberies near where the new airport will be built |
Since the crime data comes from FOIA requests to the SSPDF (Mexico City Police), I’ve added free email announcements to keep you informed of when new data is available:
Notifications in English
Notifications in Spanish
There’s even an API with lots of cools stuff:
| Service | Action | URI |
|---|---|---|
| Point in Polygon | Given a longitude and latitude return the corresponding cuadrante and sector | |
| Time Series | Crime counts ordered by month of occurrence for a cuadrante or sector | |
| List Cuadrantes or Sectores | Sum of crimes that occurred in a cuadrante or sector for a specified period of time | |
| Top Most Violent | A list of the cuadrantes and sectors with the highest rates (sectores), crime counts (cuadrantes) or change in crime counts (cuadrantes) | |
| DF data | A time series of the sum of all crimes that occurred in the Federal District | |
| Enumerate | Get a list of the names of all cuadrantes, sectores or crimes |
P.S. Yes, I know the Spanish translation is not complete, but I’ll finish it someday
P.P.S. The code is available at GitHub. It was built with Python + Flask + PostgreSQL + PotsGIS + Redis + D3 and an unholy combination of jQuery and AngularJS