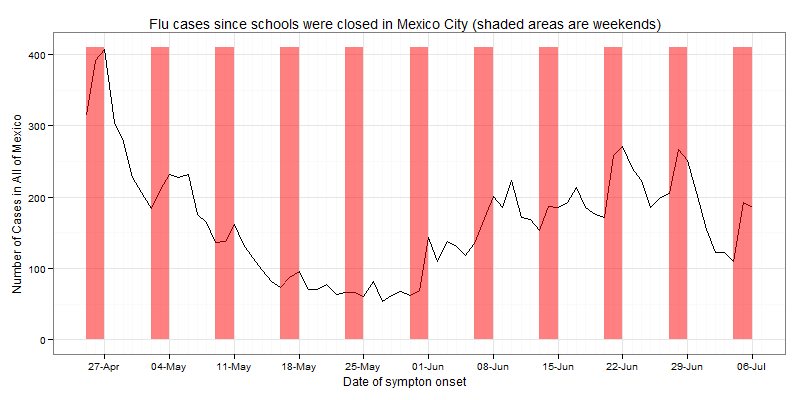
Can you see a pattern in the above graph? If you focus on the time-span after the schools were ordered closed in Mexico City on April 24 (right before the highest number of flu cases) there’s a sharp increase in people who start showing symptoms on Saturdays and a decrease starting on Mondays, which means that if the incubation period is 1-4 days, they got infected during the week. Or maybe with the economy expected to shrink by 7% this year people were just afraid of losing their jobs by taking sick leave :(
Using R we can get the seasonal decomposition and the trend in swine flu cases:

The seasonal trend is pretty clear, a sharp rise during the weekend and a decrease in the number of cases starting on Mondays.
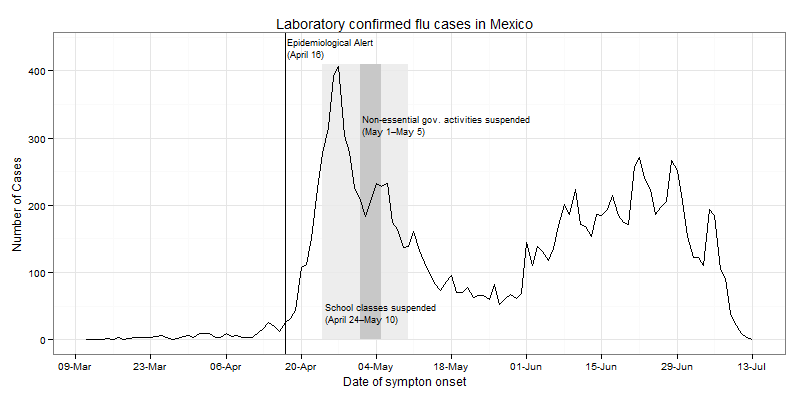
All those lab confirmed flu H1N1 cases caused a total of 125 deaths from March 10th to July 13. To put things in perspective, in the years before A(H1N1) made the jump to humans, during the months of April alone the old flu used to cause about 550 deaths from influenza and pneumonia among adults 65 or older, and about 300 deaths in children less than two years old. Since those 125 deaths were certainly not the only ones, and in fact the Mexican goverment declared the health alert because of an unexpected excess mortality in influenza cases in April, it would be nice to inspect the data, unfortunately I wasn’t able to find it:(
The flu cases data is here