As a first step I grabbed the effective preference election poll data from the poll of polls run by ADN Político (are there other data sources?), but it seems to be missing some polls by El Universal-Buendía y Laredo, so I added them manually. I chose a Dirichlet regression since the votes for the candidates have to sum up to 100%.
The model is a gross oversimplification since some pollsters are biased and surely some are more reliable than others. I did not take this into account. The poll themselves are run over several days and I chose the mid-date of their date range as the polling date. Also, since I’m using effective preferences the algorithm to apportion undecided voters could be improved.
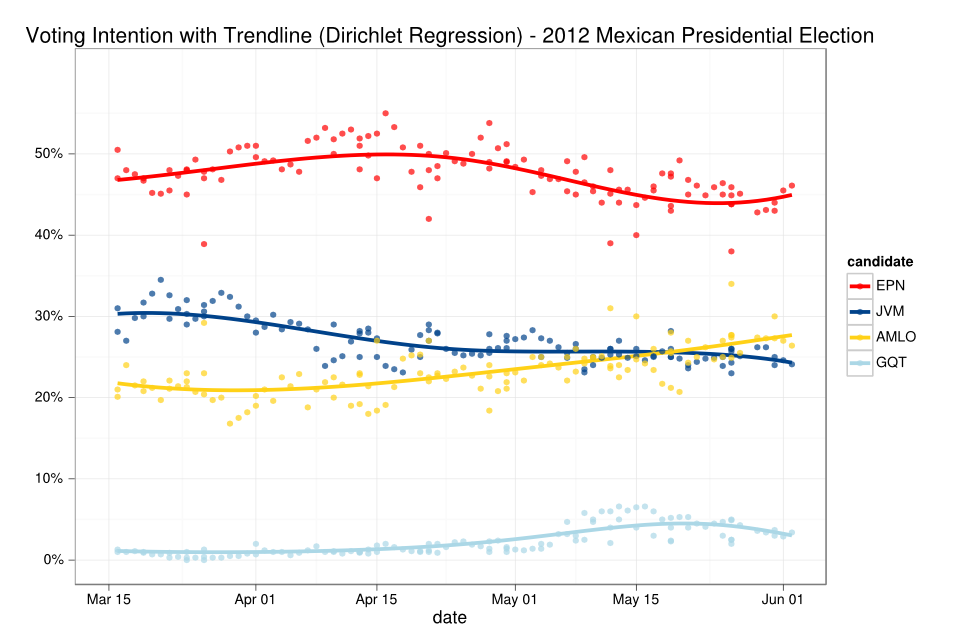
As we can see in the chart at the top of the post, Enrique Peña Nieto enjoys a commanding lead over his rivals, although he has fallen somewhat over the last month. López Obrador is now solidly in second place and Josefina Vázquez Mota has fallen to third place after a long downward trend. Gabriel Quadri is last, but his polling went up after the debates.
In the next chart I compare the different polling organizations against the trendline. Being far from the trendline doesn’t necessarily mean the pollsters are biased —it may be that the pollster with many outliers actually has the best poll and all the rest are biased. I’m just trying to get a feel for the way each pollster trends. And yes, you can guess which poll was conducted by Reforma just by looking at the big yellow and red outliers near the end of June.
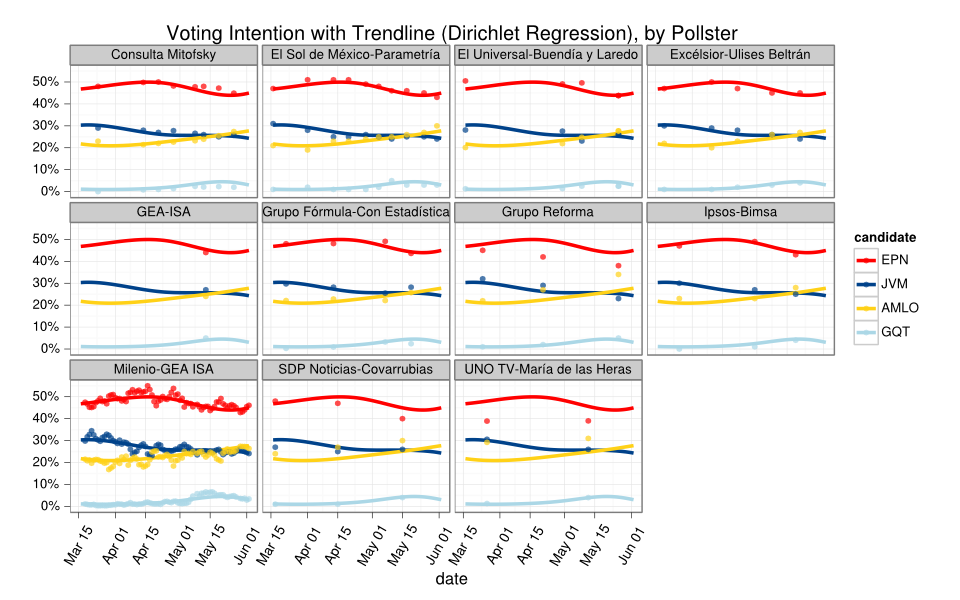 |
| Pollsters compared to the trendline |
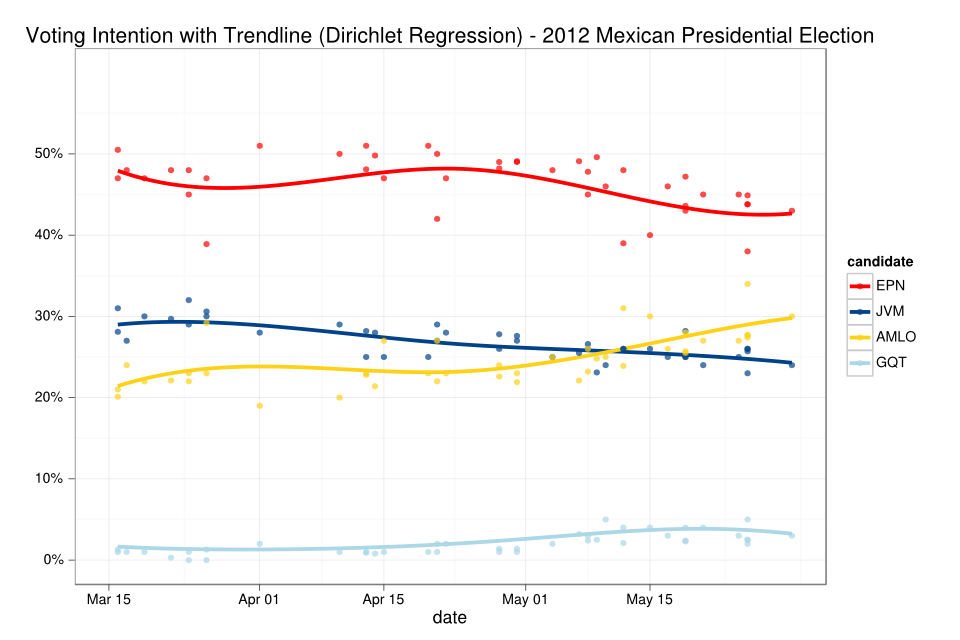 |
| Poll of polls excluding pollster GEA-ISA |