 |
| Click on the image to visit the interactive drug war map. Or try the Spanish version |
If you’re interested at all in what’s happening in Mexico you can’t miss the interactive map of the drug war I just made. You can link directly to cities or whole regions within Mexico and post them to Twitter and Facebook by clicking on the “Share This Map” link at the bottom of the box. You can even compare 2007 México with 2010 México and switch between drug war-related homicides and total homicides (the ones from the INEGI). If you hover over the chart you’ll get the monthly values and information on important events. To top it off you can export the monthly data to csv. You’ll need a latest generation browser to use it.
To unclutter the map and following the lead of the paper Trafficking Networks and the Mexican Drug War by Melissa Dell, I decided to only show the optimal highways (according to my own data and Google Directions) to reach the US border ports from the municipalities with the highest drug plant eradication between 1994 and 2003 and the highest 2d density estimate of drug labs based on newspaper reports of seizures. The map is a work in progress and is still missing the cocaine routes, but hopefully I’ll be able to add them shortly.
My assumptions in making the map:
- Homicides that were registered with no date of occurrence were assumed to have occurred on the month they were registered.
- The total homicide database has a cutoff date of the last day of the year for recording deaths, so for example, in 2009 there occurred 671 homicides that weren’t registered until 2010 (most occurred in December). I adjusted the 2010 database assuming the homicides were under counted by the same percentage as they were in 2009. So instead of the 25,005 Â homicides in the database I’m showing the adjusted number of 25,679. I used a similar adjustement at the municipality level.
- Even though the municipalities of Culiacán and Navolato are not officially a metro area I considered them one since they are only half and hour from each other and together have a million inhabitants.
In Jalisco, Colima, and Nayarit, violence was increasing systematically previous to the killing of Nacho Coronel at a rate of more than 1 death per week, or 6 extra deaths every five weeks. After his death violence remained at a high level, but it increased at a much slower rate, barely 1 death every five weeks.But did violence really stop increasing near Guadalajara? This should serve as a warning not to extrapolate based on a few months of observations and underlines the importance of making the data available to researchers on a prompt basis to avoid embarrassing mistakes.
[…]
Replicating the analysis with data from the state of Jalisco, the region where Nacho Coronel was killed, and even with data from Zapopan, we obtain the same results
—Alejandro Poiré, Nexos
There are about a million things you can analyze with the maps:
- The weird falls in homicides in Chiapas around the end 2007 and 2009.Â
- Why did Sinaloa end up with more drug war-related homicides than total homicides from mid 2007 until the end of 2008? (the answer will be my next post)Â
- The sudden increase in homicides in Nuevo León and Tamaulipas around the end of February when the Zetas and CDG (Gulf Cartel) went to war with each other.Â
- Perhaps you heard that México is much safer than a certain other much smaller country or sub-country region and wish to only compare certain parts of México with a similar population/shape to the much smaller country/sub-country region.Â
- The super secret link to the 2011 drug war-related homicides. (The size of the circles and the color scale used to fill them was annualized so it’s on the same scale as the years for which full data is available, but the numbers shown on the map correspond to the Jan-Sep data).Â
- Are the Zetas really the most brutal cartel as the Mexican Government and Stratfor assert? You can compare northeastern Mexico to Chihuahua and find out just how mistaken they are, both in terms of rates and total homicides.
- How the Tubutama massacre is registered as having occurred in Tubutuma according to the homicide database, but in Saric according the drug war-related homicide database
A note about drug war-related homicides
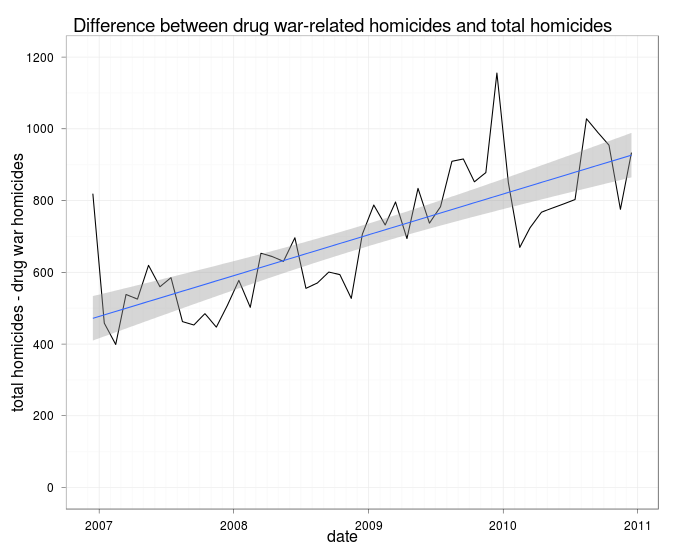
I’d be very surprised if the Mexican government had the capacity to correctly count the drug war homicides. There were big differences between the homicide databases starting in 2009 in Tijuana and in 2010 in Juárez. I tend to think of the drug war-related homicides as an independent count of a subset of firearm/extremely violent homicides based on police records rather than death certificates (independent of whether organized crime was involved or not). Looking at the whole country there has been a steady increase in the difference between INEGI homicides and the drug-war related ones.

This is not to say that the data for INEGI is without errors, besides not having registered the mass grave in Taxco and the immigrant massacre in San Fernando, there has been a steady increase in deaths of unknown intent by external injury caused by firearm. In Mexico most accidents are by transportation, most suicides by suffocation and most homicides by firearm, so a quick and dirty way to see if a more in-depth analysis is needed is to look at firearm deaths:
 This is not to say all the deaths were homicides, since it would be perfectly reasonable to expect that as the availability of firearms increases, the number of accidents involving firearms increases, but the evidence does suggest that there has been an important under counting of homicides and even more so of drug war-related homicides.
Deaths of unknown injury intent in all of Mexico that were by firearm:
You may also be wondering why there were more drug-related homicides than total homicides in the Frontera Chica, but not in the northern region Nuevo León. The most likely cause is that some homicides were registered as deaths of unknown intent in Tamaulipas, but not in Nuevo León.
Deaths by firearm that were not homicides in Tamaulipas:
A similar thing happened in Durango, it’s most obvious in La Laguna. Deaths by firearm that were not homicides in La Laguna:
This is not to say that the data for INEGI is without errors, besides not having registered the mass grave in Taxco and the immigrant massacre in San Fernando, there has been a steady increase in deaths of unknown intent by external injury caused by firearm. In Mexico most accidents are by transportation, most suicides by suffocation and most homicides by firearm, so a quick and dirty way to see if a more in-depth analysis is needed is to look at firearm deaths:
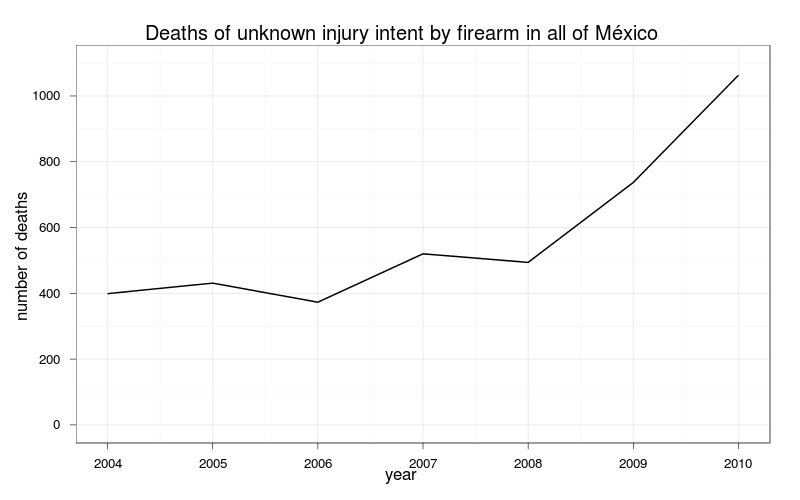
Deaths of unknown injury intent in all of Mexico that were by firearm:
| Year | Cause | Deaths |
|---|---|---|
| 2004 | Firearm | 399 |
| 2005 | Firearm | 431 |
| 2006 | Firearm | 373 |
| 2007 | Firearm | 520 |
| 2008 | Firearm | 494 |
| 2009 | Firearm | 737 |
| 2010 | Firearm | 1,063 |
You may also be wondering why there were more drug-related homicides than total homicides in the Frontera Chica, but not in the northern region Nuevo León. The most likely cause is that some homicides were registered as deaths of unknown intent in Tamaulipas, but not in Nuevo León.
Deaths by firearm that were not homicides in Tamaulipas:
| Year | Cause | Deaths |
|---|---|---|
| 2004 | Firearm | 46 |
| 2005 | Firearm | 47 |
| 2006 | Firearm | 33 |
| 2007 | Firearm | 39 |
| 2008 | Firearm | 54 |
| 2009 | Firearm | 45 |
| 2010 | Firearm | 251 |
A similar thing happened in Durango, it’s most obvious in La Laguna. Deaths by firearm that were not homicides in La Laguna:
| Year | Cause | Deaths |
|---|---|---|
| 2004 | Firearm | 9 |
| 2005 | Firearm | 10 |
| 2006 | Firearm | 10 |
| 2007 | Firearm | 14 |
| 2008 | Firearm | 28 |
| 2009 | Firearm | 61 |
| 2010 | Firearm | 120 |
P.S. You can download the source at GitHub