To backup their claims Poiré and Martínez used weekly drug war-related homicide data which are not publicly available (at least not to people who question the Mexican government’s strategy since they did make it available to Joaquín Villalobos). To perform my own analysis I’ll use the daily (grouped by week) homicide data available from the Mexican vital statistics system and confine my analysis to the state of Jalisco.
Fitting an AR(1) model to the weekly data I find two breakpoints whose 95% confidence intervals contain the capture of “El Mochomo” (week 212), and as Poiré and Martínez state in their article, the kidnapping of Nacho Coronel’s son (week 327). The breakpoint coinciding with the capture of “El Mochomo” is where things get interesting since Poiré and Martínez did not include it in their analysis of the rise in violence.
##
##   Confidence intervals for breakpoints
##   of optimal 3-segment partition:
##
## Call:
## confint.breakpointsfull(object = bp.ri)
##
## Breakpoints at observation number:
##   2.5 % breakpoints 97.5 %
## 1   211         223    236
## 2 322 325 330Given that the Beltrán Leyva brothers ordered the killings of the son of “El Chapo” and the son “El Ondeado,” it is all but certain that the kidnapping and subsequent killing of Nacho Coronel’s son was revenge for the capture of “El Mochomo.” Thus, I find it a glaring omission that Poiré and Martínez would not analyze the capture, even if they were partly right about the kidnapping having sparked a new round of violence.
In addition to the structural change I used a dynamic linear model or state space model to compute the kalman smoothed value of weekly homicides adding dummy regressors indicating whether “El Mochomo” had been captured or the son of “Nacho Coronel” kidnapped.
 |
| The blue line represents the kalman smoothed estimate of weekly homicides in Jalisco with its associated 95% confidence interval |
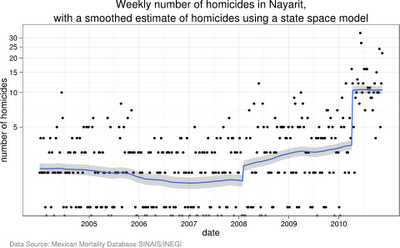
Nayarit:
 |
| The blue line represents the kalman smoothed estimate of weekly homicides in Nayarit with its associated 95% confidence interval |
 |
| The blue line represents the kalman smoothed estimate of weekly homicides in Colima with its associated 95% confidence interval |
As we can see from the charts and contrary to what Poiré and Martínez express in their article, the fall of drug lords sometimes does coincide with an increase in homicides, and may drive them to seek revenge on their rival’s families.
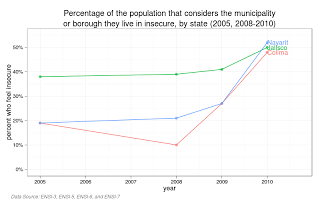
Percentage of population that considers the municipality they live in insecure:
 |
| Source: Tabla II-55 |
P.S. Gist with the source