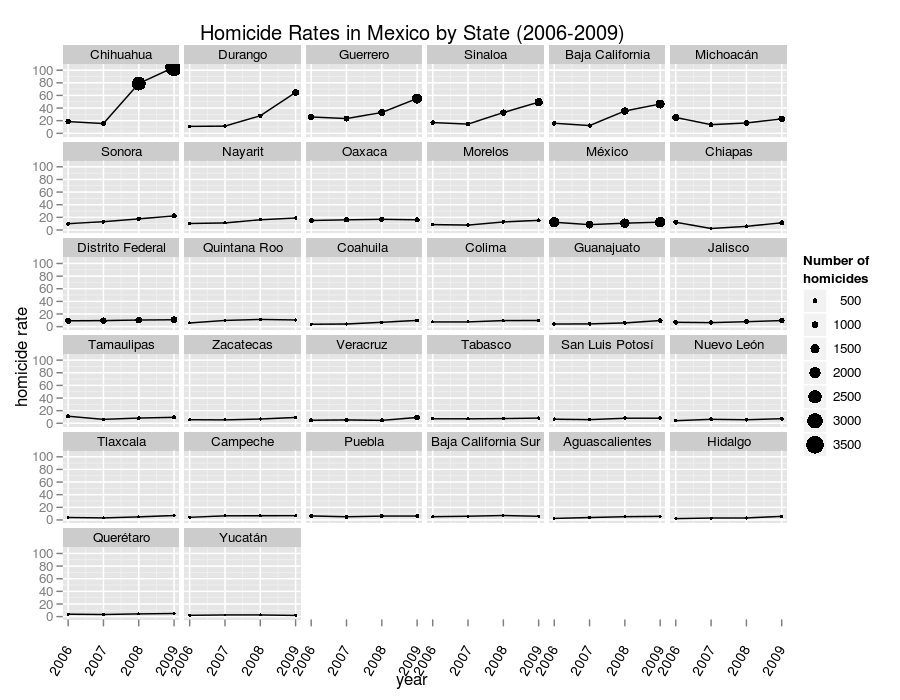
Posted on Thu 27 January 2011

Homicides in Mexico 2006-2009

Just today the Mexican government released to the public the mortality database for 2009, and as you can see from the chart Mexico has suffered from a steep rise in homicides from 2008 onward and very likely reached the highest violence rate in recent history last year. Since the Mexican government also recently made available a database of homicides presumably linked with the drug war we can divide homicides into those related to the drug war an those that are not:
Most of the increase has been because of the drug war, though as Mexico becomes more violent there has been a small rise in homicides not related to the drug war.

By State:
For females:
The most violent municipalities:
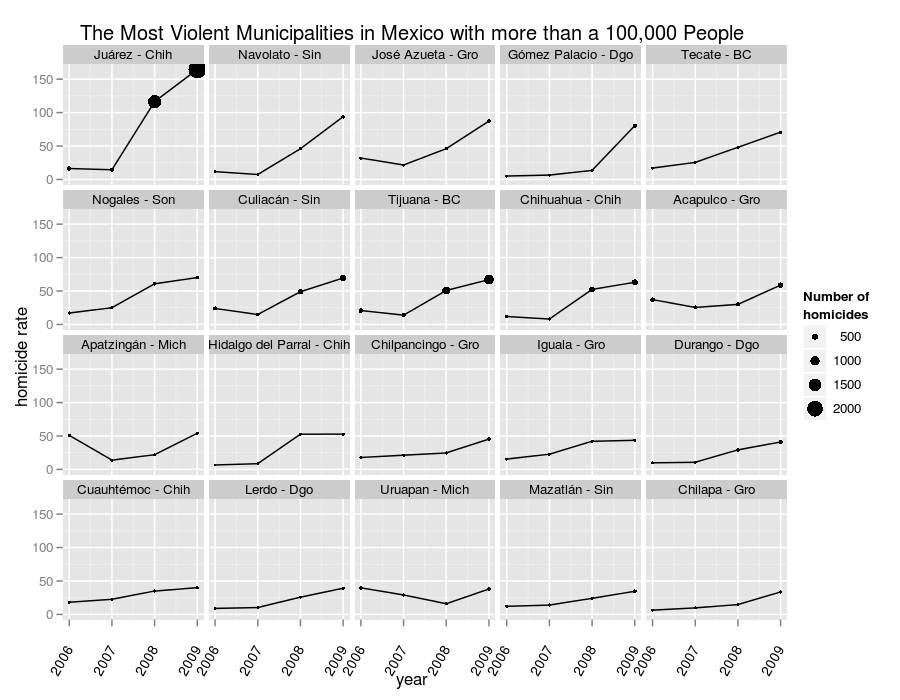
Ciudad Juárez was again the most violent municipality with a total of 2316 (about 2375 taking into account that there wasn’t enough time to record all homicides that occurred in 2009 into the database) which is much lower than the press reports of about 2700.

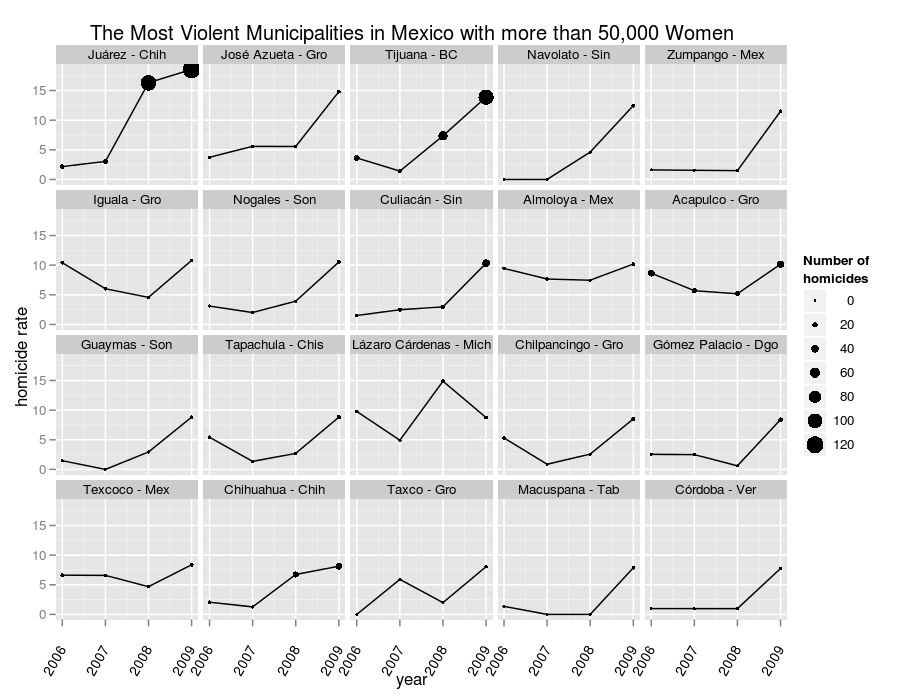
What stands out from the chart of the most violent municipalities for females is that Almoloya and Texcoco in the state of Mexico made the list (hint hint future gubernatorial candidates).

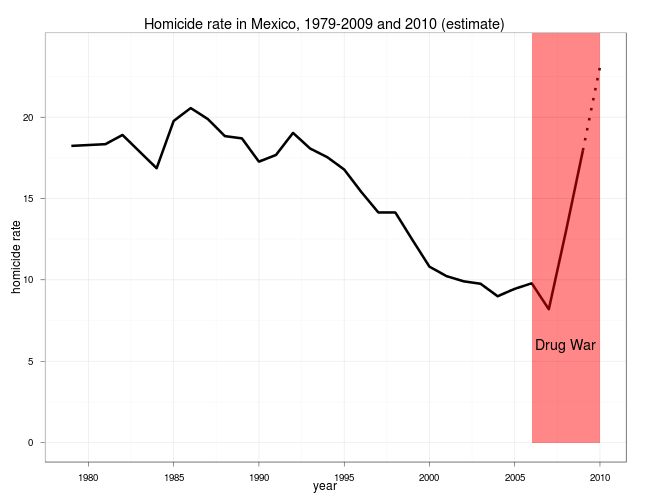
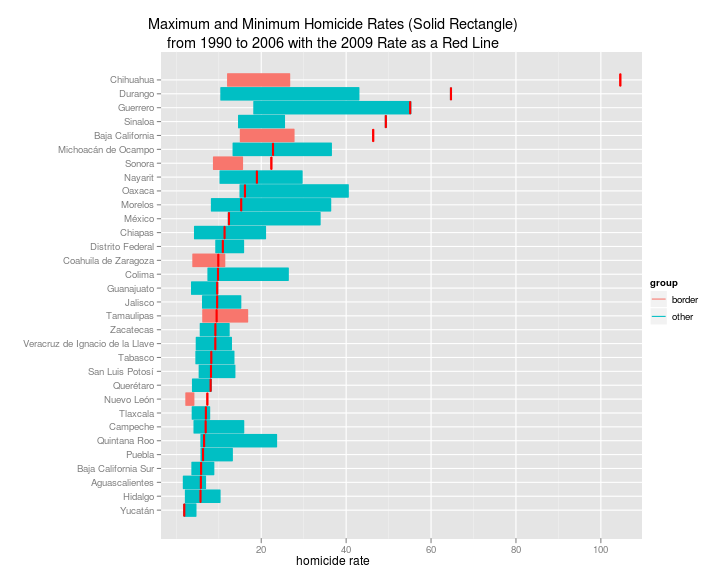
In this chart I show the maximum and minimum homicide rates from 1990 to 2006 (right before the drug war started) and compare it with the 2009 rate to put it in historical perspective:
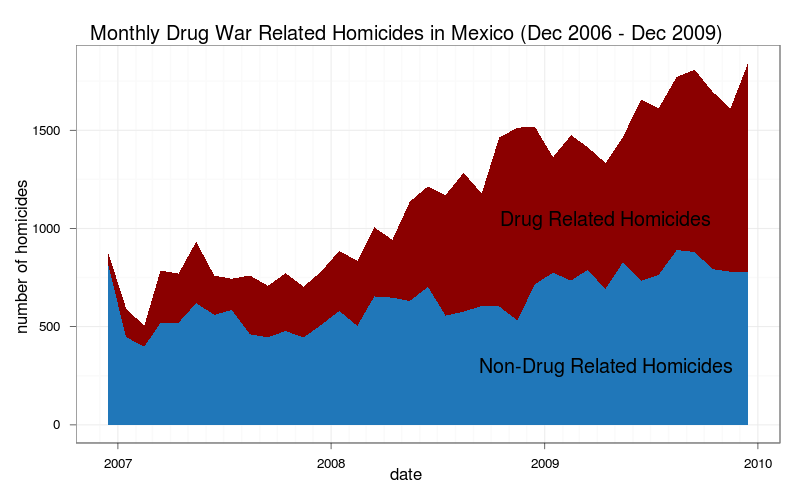
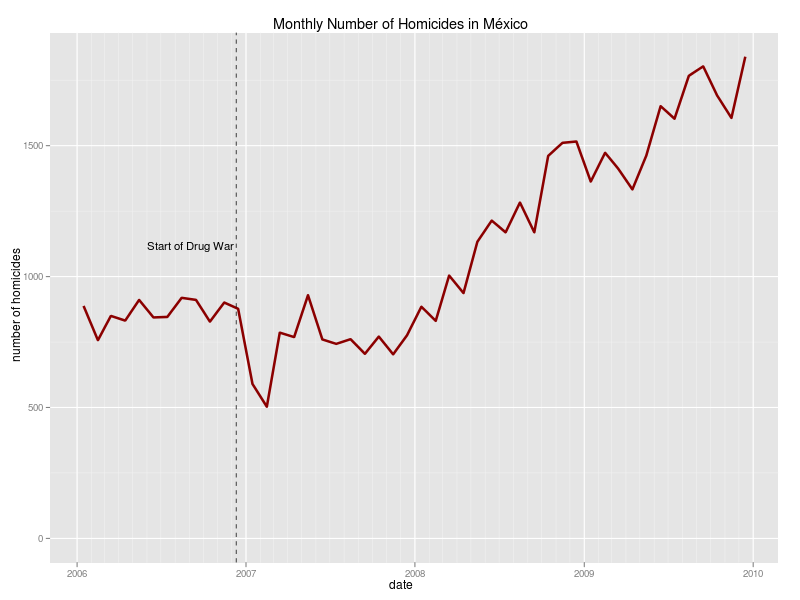
Interestingly, the rate for Michoacán in spite of the drug war is nowhere near its maximum. The rate for 11 states is above or near their maximum from 1990 to 2006 and for 7 it is at or near their lowest rate (hint hint future presidential candidate).

The monthly totals:
The weekly totals:
If the data follows the same pattern as in 2008, homicides in 2009 were under-counted by about 4%, which is perfectly understandable since there isn’t always time to enter into the database those homicides that occured during the last weeks of the year and the cutoff is December 31, 2009.

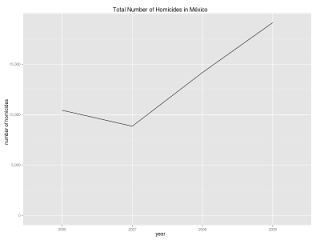
Taking into account the undercount for the last year the totals would be:

2006 - 10,429
2007 - 8,843
2008 - 14,175
2009 ~ 19,900 (19,121 recorded in the database)

which assuming a population of 111 million (there were 112.3 million Mexicans in the 2010 census) would give a homicide rate of:

18

which is of course quite different from the 16,117 homicides according to police reports, and their corresponding rate of 15.

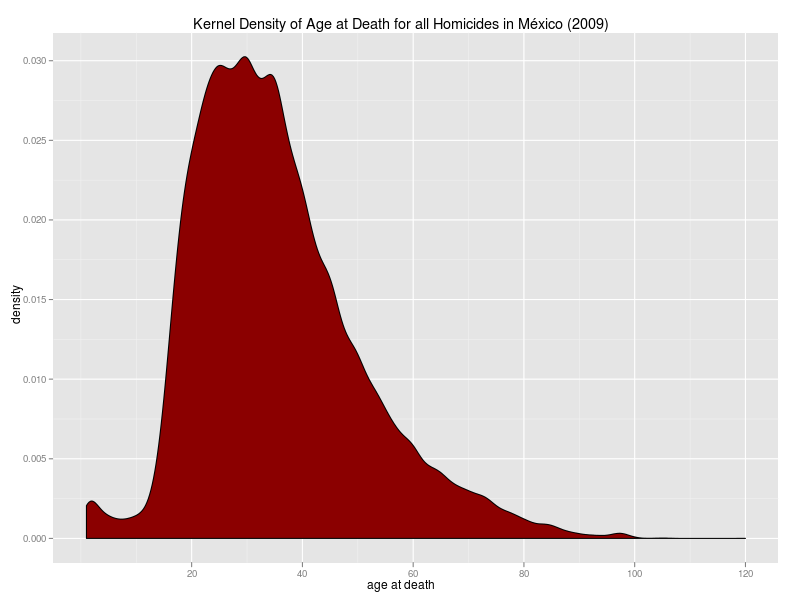
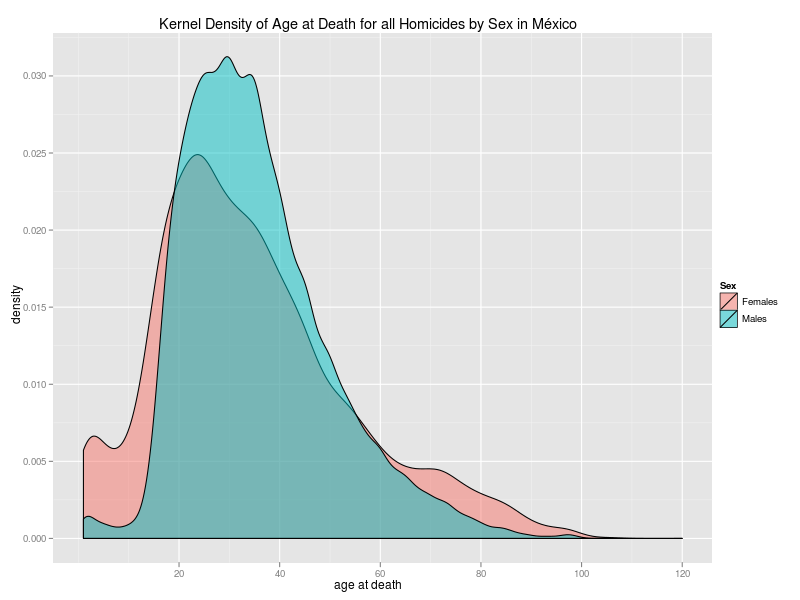
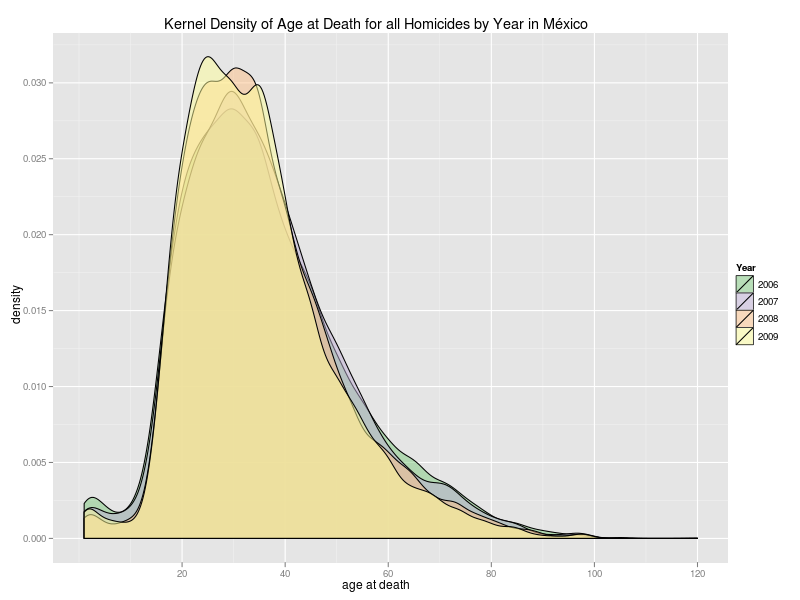
The mean age for homicide victims in 2009 was 34.6 with a sd of 14.3 years (it hasn’t changed significantly since 2006):
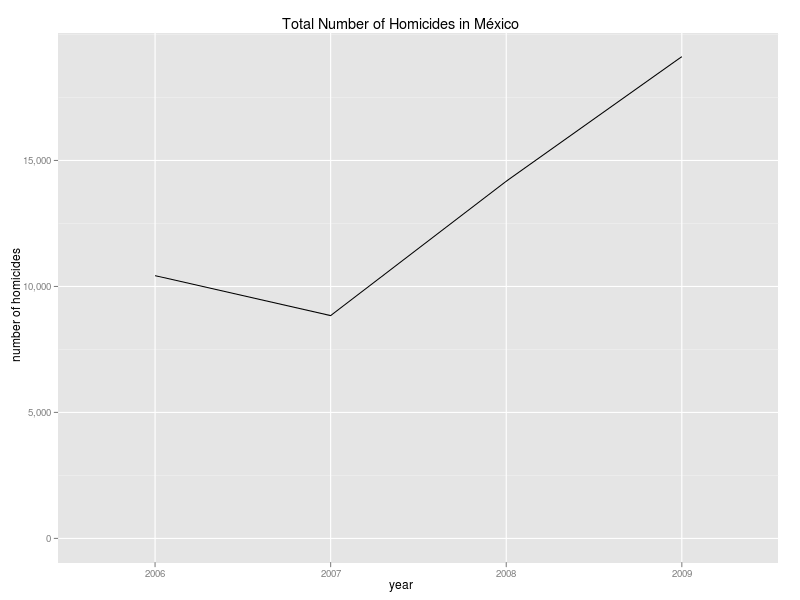
Men are proportionally much more likely to be homicide victims between the ages of 18 and 47:
The increase in homicides since the drug war went charlie-foxtrot was especially acute among 18-40 years olds:
Homicide victims by age groups:
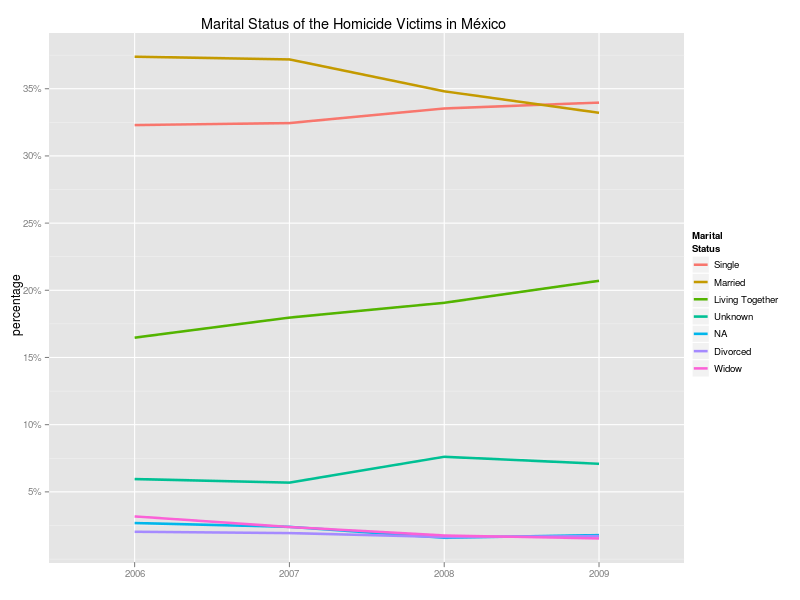
Marital status of the homicide victims:
There was a big increse in the proportion of victims whose ocupation was unknown (maybe it’s time to include “sicario” in the list of occupations):
The proportion of homicides that occurred out in the streets keeps on increasing:
The educational attainment of homicide victims:
When violence increases it’s usally men who suffer the most, though according to newspaper stories there was a big increase in the proportion of women murdered in Ciudad Juárez in 2010, maybe the increase in the percentage of homicide victims who are men will stop next year?
The rate of increase in homicides commited with a firearm slowed down:
Right before midnigth is the most dangerous time in México:
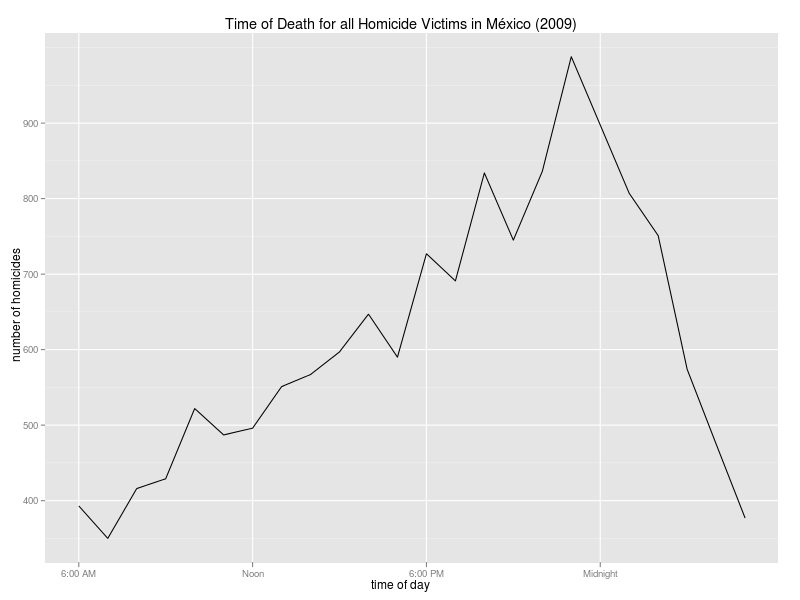
(There was a mistake in the database, when the hour of death was unknow it was coded as having occurred at midnight, I discarded that value and used the average of the number of homicides between 11:00pm and 1:00am)

Sunday is the most dangerous day of the weekThere was no statistically significant difference between the days of the week:
Technical Note: The population for the first chart was interpolated from the CONAPO estimates for 1990-2000 and the 2010 census since the official estimates for 2010 were off by 4 million people. The state and municipality rates are the ones done by the CONAPO since creating new estimates would depend on calculating the correct fertility rates, the lower than expected immigration rates, the number of people who have left the most violent municipalities and why the 2005 population survey came out so wrong. The 2010 homicide rate was calculated from a linear regression based on execution rates.

P.S. The code is at my GitHub


Unless otherwise stated, the content of this page is licensed under the Creative Commons Attribution 3.0 License, and code samples are licensed under the Apache 2.0 License. Privacy policy

Disclaimer: This website is not affiliated with any of the organizations or institutions to which Diego Valle-Jones belongs. All opinions are my own.

Special Projects:

Blogs I like: