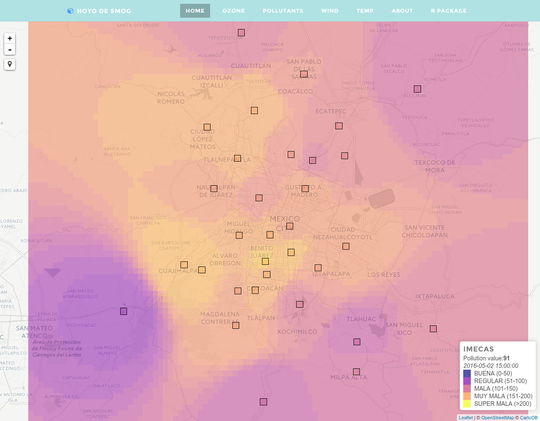
Aside from having the most ridiculous possible name the state of Mexico City has battled with air pollution for decades. Since the official air quality website looks pretty bad, I decided to create my very own website, HoyoDeSmog, that is updated in real-time every hour. To power the site I’ve also created an R package.
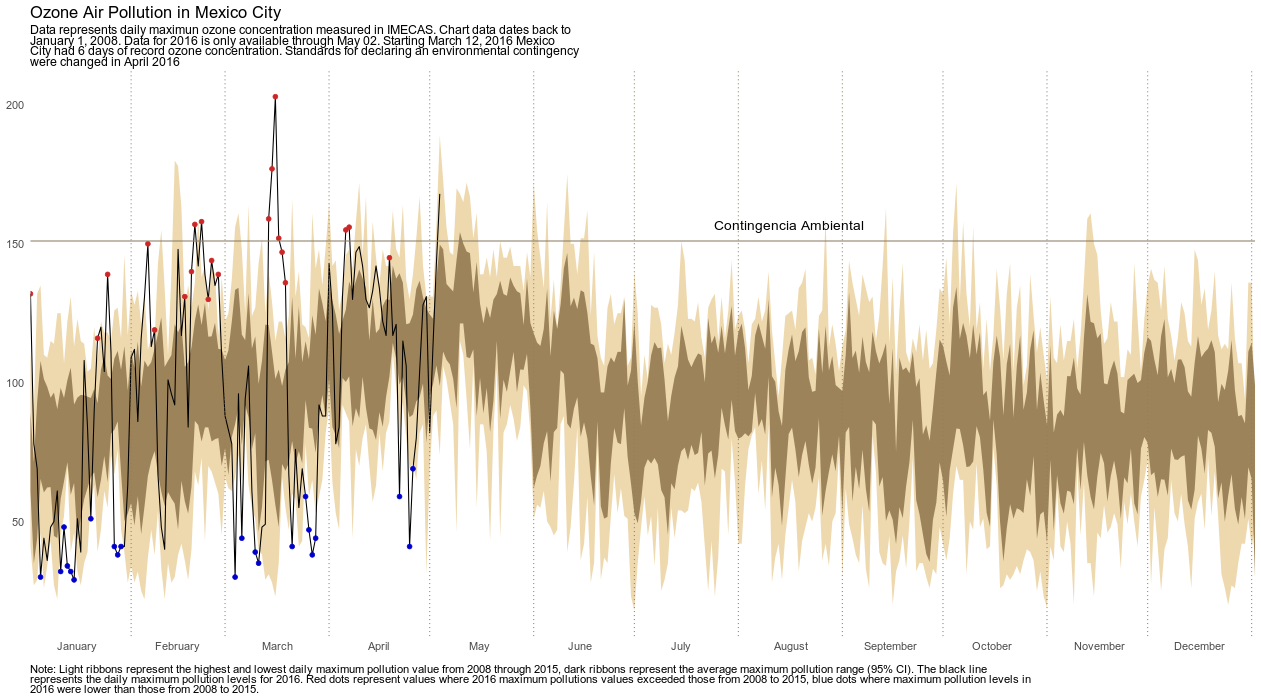
The pollutants with the highest reported values are usually ozone and PM10 (particulate matter). Because of the high temperatures and lack of rain May is usually the worst month of the year for ozone air pollution:
The peak hours for ozone pollution are in the early afternoon and for PM10 coincide with commuting times. Though for PM10 pollution a 24 hour average is what is used to quantify air quality.

Mexico City has a no circulation rule, cars which do not meet emission standards are forbidden from being driven one day a week. A 0-500 scale is used to inform residents of the Mexico City metro area about pollution values. If pollution values reach 151 points (from April until June, otherwise it’s 191) a double no ciruclation rule is put into effect which should forbid about 40% of cars from the streets.
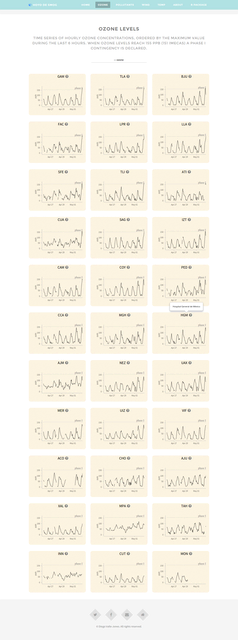
Ozone is usually the pollutant with the highest values and for which environmental contingencies are declared, so there is a whole a page to view the latest values:
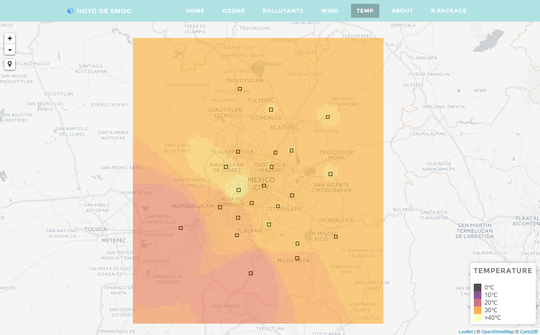
You can also view temparature values (interpolated by inverse distance weigthing from the measuring station):
And an animated map of wind speed and direction:
Problems with the data
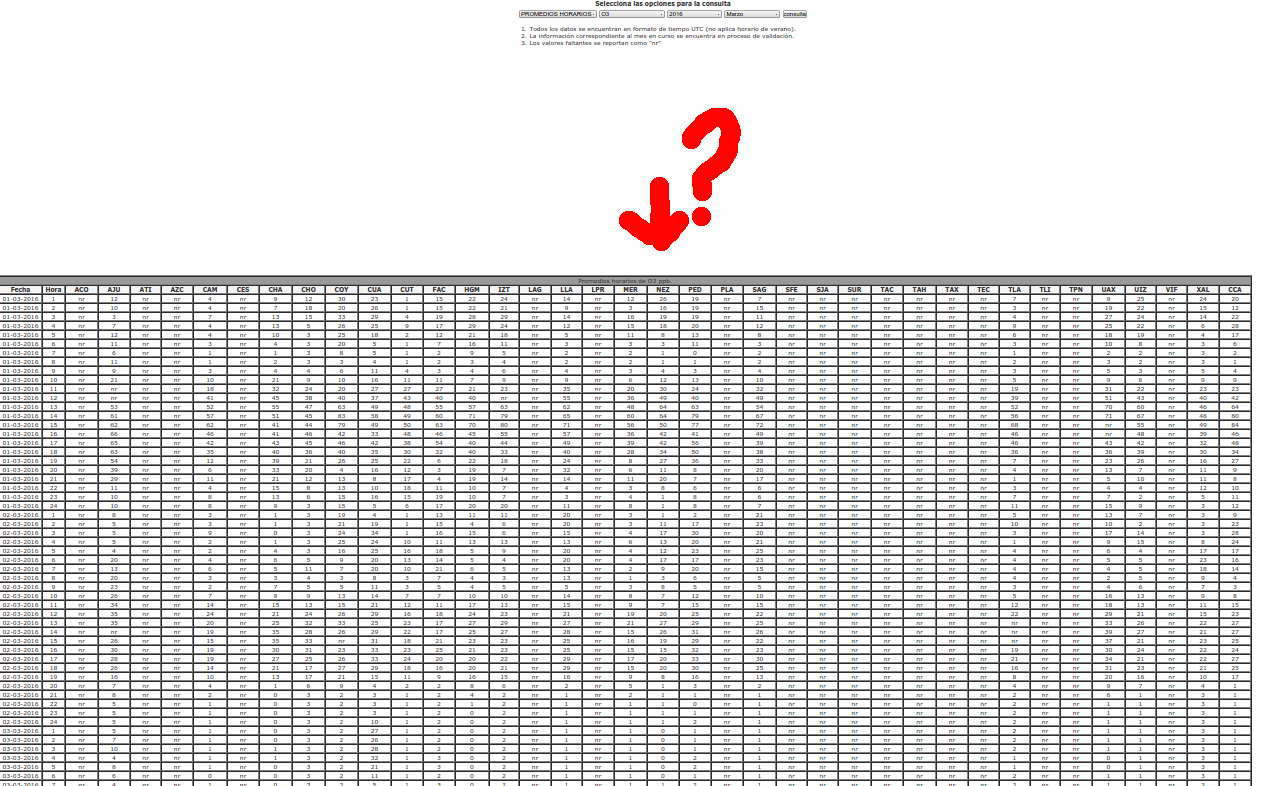
Like I said, the official website sucks, and one of the problems with it was that some of the stations, like MPA, were missing from the webpage where you could download data. In this old screenshot you can clearly see that there was no station named MPA:
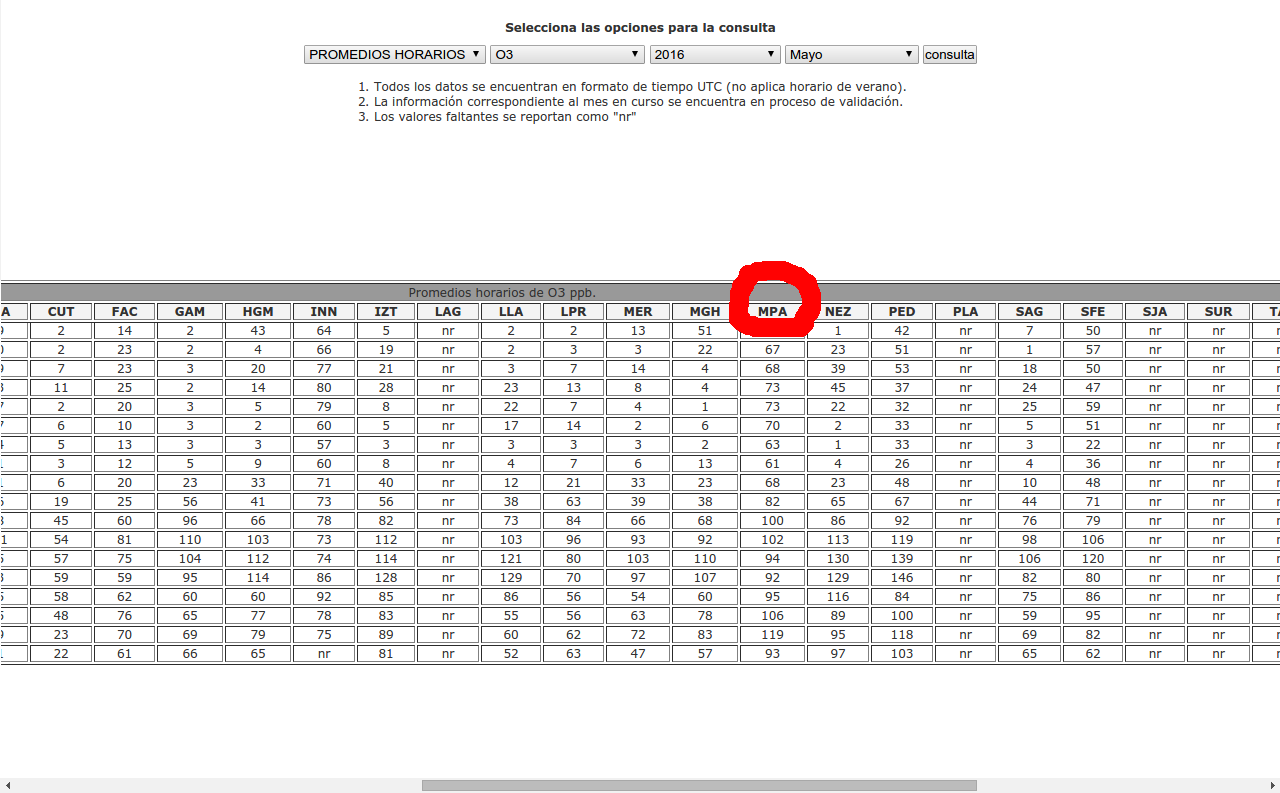
I reported the problem and the website now includes the missing stations:
Sadly, in fixing the problem they broke the querying system and now you can’t download data from before 2015 ( try it here ). My R package doesn’t have this problem.
Some stations were also missing from the list available for download from the website. I added them manually by using Google Maps.
In addition to all this, when you download pollution data there is a station called CHA, but in the hourly report it is instead called MON (Texcoco). In the R package I always use the station code MON. Of course now I’m afraid to report all these problems in case the state of Mexico City government screws up the website even more.
Problems with conversions
As I mentioned the government uses a 0-500 scale in IMECAS to communicate to public how polluted the air currently is. To convert to IMECAS from the original units in which the pollutants are measured the government uses stepwise functions, but I’m unable to replicate the values you are supposed to get using the official formulas and websites.
For example, when I try convert an NO2 value of .150 ppm to IMECAS using the formula I get a value of 72
I[NO2]=1.587+C[NO2]*49/0.104
but 71 if I use the html form on this website
There is also an issue where you have to use the 24 hour average to calculate IMECA values (as with PM10) and it is not document what happens when there are missing values (it’s not listwise deletion).
All this means that except for the frontpage map all values are reported in the original units (ppb, µg/m³, etc) in which pollutants are measured.
P.S. The R package is available from GitHub