
After reading The Better Angels of Our Nature: Why Violence Has Declined, by Steven Pinker, and looking at reviews of the literature on homicide decline in Europe, it seemed to me as if some of the posited reasons for the decline of violence would involve strong cohort effects —each generation successively becoming less and less violent. This immediately reminded me of Mexico, and so I decided to take a quick look at the data:
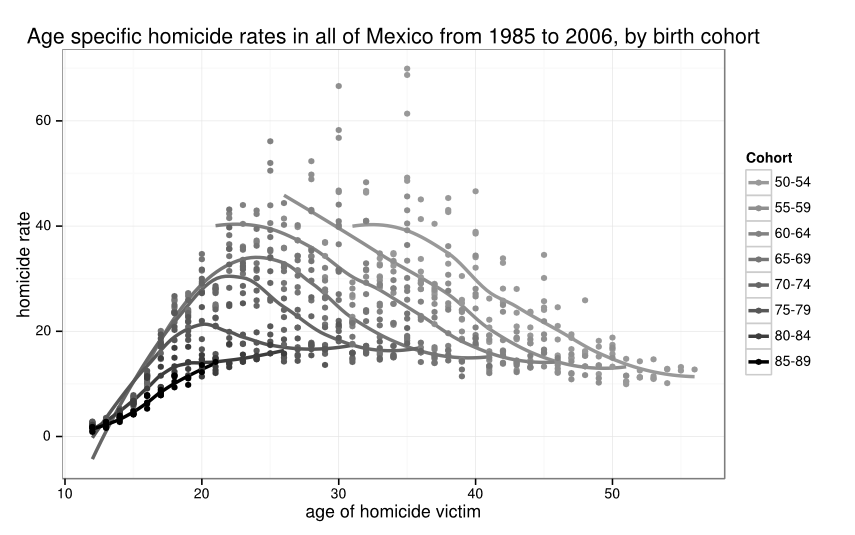 |
| Each cohort group is connected by a loess line(only ages 12-60 are shown in the graph) |
For a more formal analysis of the decline of violence I used homicide data from the INEGI/SINAIS at the national level from 1985 and at the state/municipality level from 1990 onwards. Since I’m interested in understanding the period before the drug war I discarded all data after 2006. As usual, there are some issues with the data:
- About 3% of homicides have no data corresponding to the age of the victim. I’ll simply ignore the missing data. The data also presents clumping of victim’s ages which end in 0 or 5, to deal with this I grouped the data by 5 year age groups.
- Some deaths of unknown intent are probably homicides, for sure I could use multiple imputation to get better estimates of the number of homicides for the age-period-cohort model, but again I’ll ignore this.
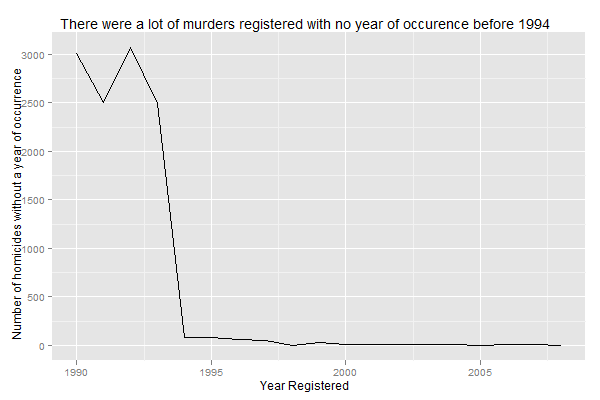
- Previous to 1994 there were a lot of homicides registered in the INEGI database with no year of occurrence recorded. I used the date of registration of the homicide as the year of occurrence before 1994 .
- There are some errors in the mortality database where homicides are registered as accidents or simply missing. And of course the Acteal Massacre is missing from the homicide database.
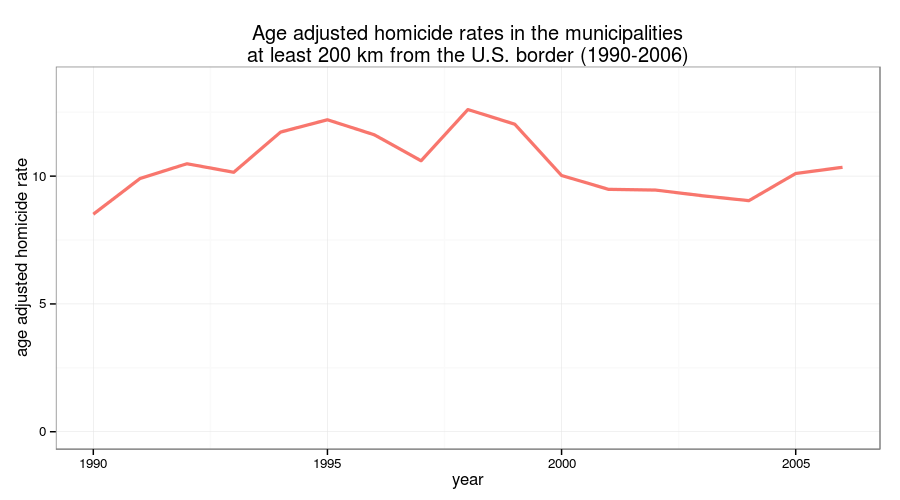
In countries with reliable statistics on offenders most women are killed by men, so I focused on total homicide victims rather than each sex since I see no reason why Mexico should be any different. To explore the data I plotted the age-adjusted homicide rates for each state of Mexico. Since the five states with the biggest declines in homicides all lie in this contiguous area of Mexico I highlighted them in blue.
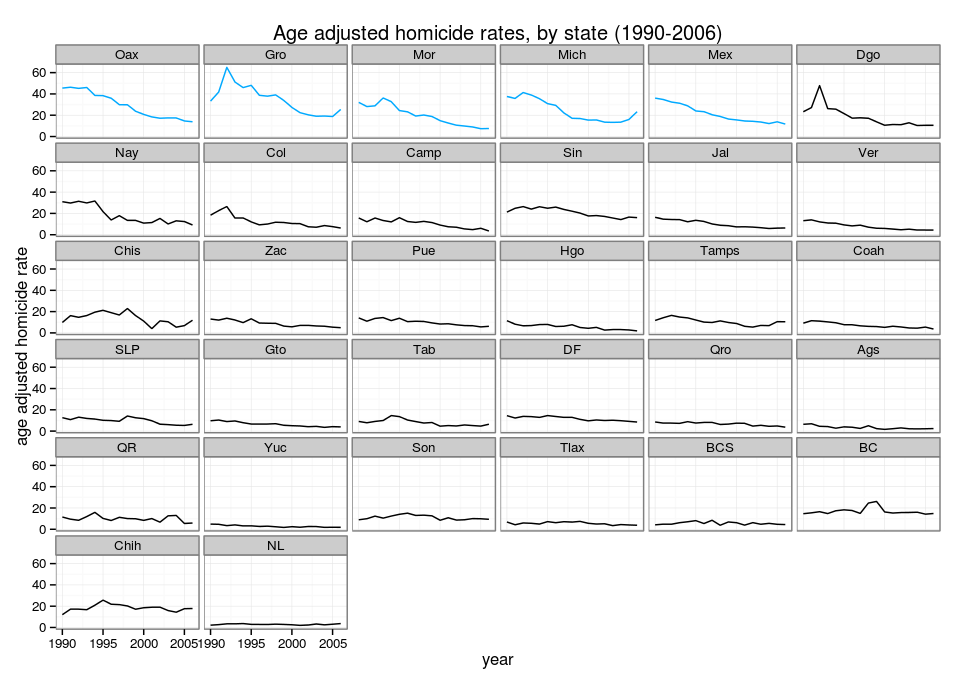
The southern states:

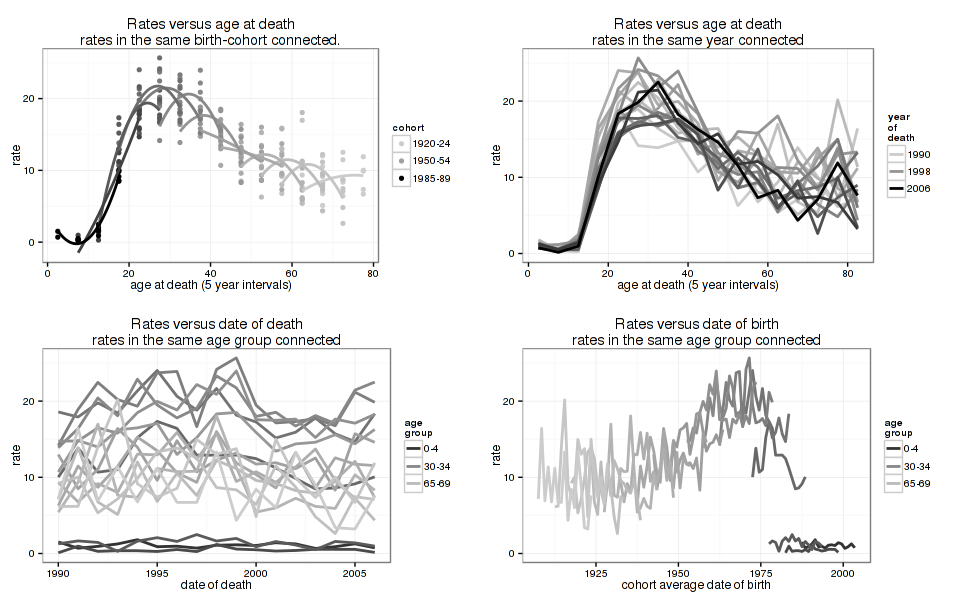
- The top left plot shows the rate versus the age with each birth cohort group connected by a quadratic polynomial regression line. You can see a very clear pattern of each cohort being less violet in the southern states but not in the municipalities near the U.S. border.
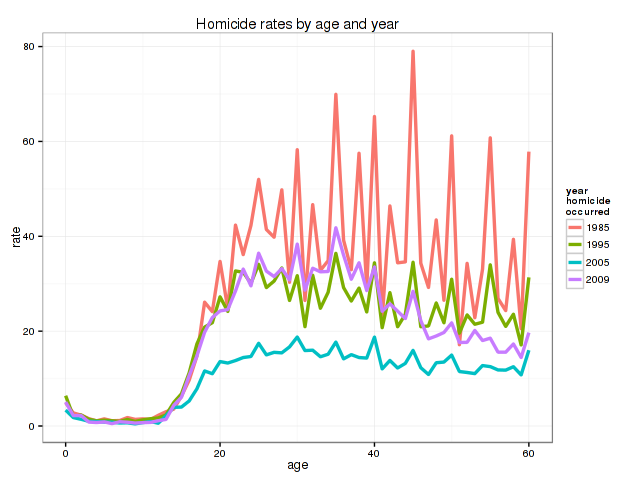
- The top right plot shows the rate versus the age, with each period connected. You can see that children have low homicide rates and young adults the highest. Near the U.S. border there is a drop in homicide rates after 40 years of age (but remember the cohort effects from the first plot!).
- The bottom left plot shows the rate versus the period, with each age group connected. You can see that the decrease in violence occurred primarily among the ages with the highest rates in the southern states but not so much near the U.S. border.
- The bottom right plot shows the rate versus the cohort, with the each age group connected. You can see how in the southern states each cohort suffered less violence than the rest, though not so much near the U.S. border (but keep in mind period effects!).
After looking at those plots it seems appropriate to fit an Age-Period-Cohort model to separate the effects of each component:
- Age effect: Changes in the rates according to biological process of aging: children have low homicides rates, young adults a high one.
- Cohort effect: Changes in the rates according to the birth date of each homicide victim. People born in the 50s were more likely to be murdered than people born in the 90s (well, until the drug war), which could reflect better schooling, higher literacy, etc.
- Period effect: Changes in the rates affecting the entire population at a given point in time, related to historical events such as the arrival of the drug cartels to the border during the 90s and the problems with the Familia Michoacana before the drug war.
In the model, I used the 1970 cohort as reference for the age and cohort effect, and 2003 as the period reference since that was the year before the expiration of the assault weapon ban, Chapo Guzmán killing the brother of the Juárez Cartel leader, La Barbie in Nuevo Laredo and the whole La Familia Michoacana thing.
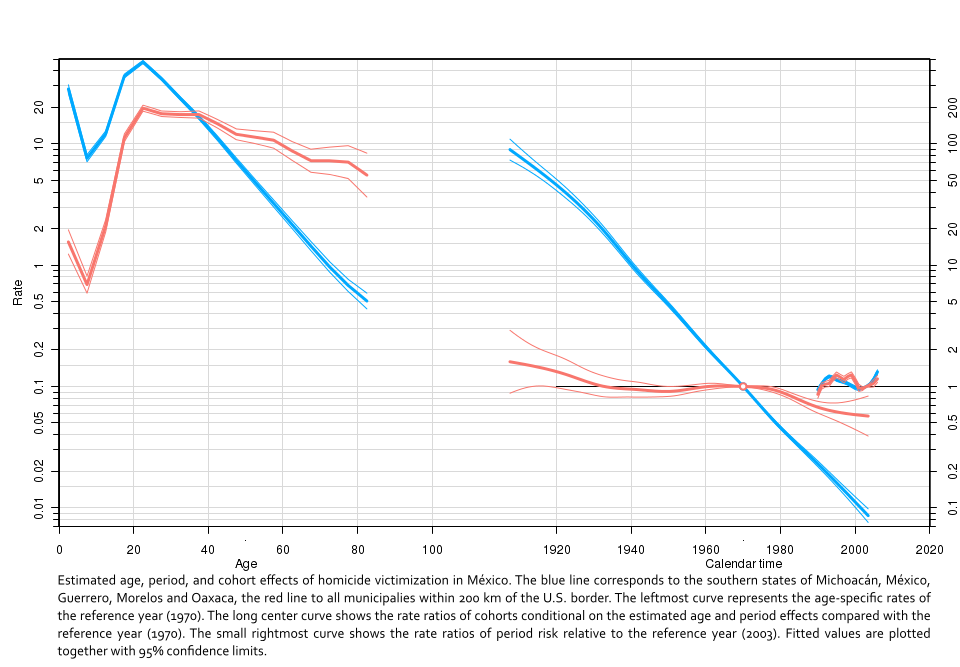
From the chart we can see that the age pattern for homicides follows that found in other countries (Fig 3.3 page 41), once we control for cohort and period effects, with the highest risk of being a homicide victim for people in their early 20s. Interestingly, near the border people remain much much violent throughout their lives. Also note how much more violent southern Mexico was compared to the U.S. border. Infants living in the south where at a higher risk of dying of murder than people in their 20s near the U.S. border (controling for cohort and period effects). This probably because people in their 20s commit infanticide and also kill their peers in their 20s.
Looking at the cohort effect there was a big decrease in violence by each successive generation. The period effect shows a rise in the early 90s which might have been related to the land reform enacted about that time (this is pure speculation) and the heightned importance of the Mexico-US border for traficking cocaine in the 90s, the model also shows a rise after 2003 which is very likely related to the whole breakup of the Federation and the rise of La Familia Michoacana as stated previously, though keep in mind its size compared to the cohort effect (they are on the same scale)
Note: I’m more interested in explaining the decline of violence in Mexico rather than predicting the drug war, so the age specific rates for the 1970 cohort are wrong after age 38 since 2008 was the year homicide rates shot up because of the drug war.
One problem with looking at homicide victims is that we ignore data on those who committed the homicides. But in Mexico there is very little data on those who commit murder, in 1930 the government detained about 6,500 presumed murderers, the same number as in 2011! But in other parts of the world those who commit homicide have similar ages to their victims, in fact they are usually acquaintances (with the obvious exception of infants).
There is also the possibility that rather than a reduction in violence the decrease in homicides could reflect better medical treatment, but Mexico also saw a reduction in all criminal activity:
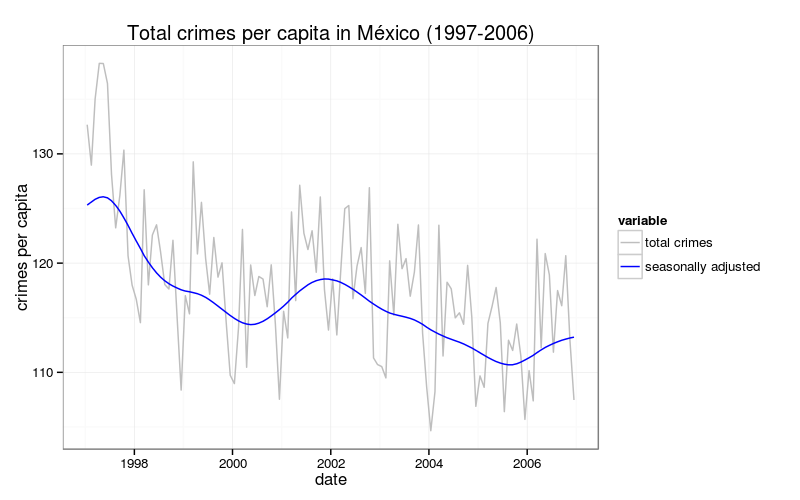 |
| The trendline was adjusted for seasonal effects and length of month |
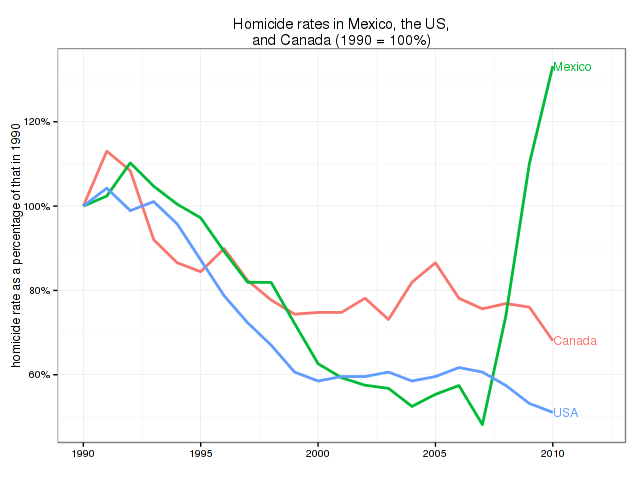 |
| Data Sources: INEGI, FBI, and Statistics Canada (Criminal Justice) |

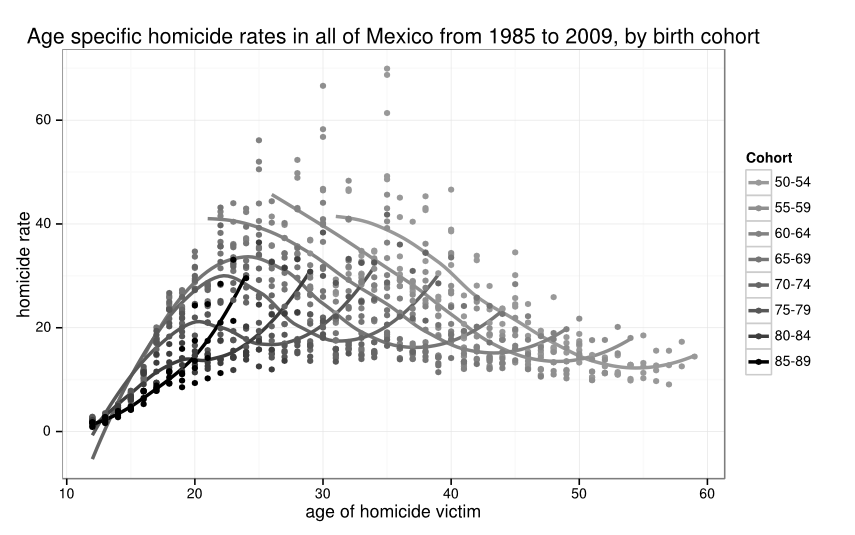 |
| Each cohort group is connected by a loess line(only ages 12-60 are shown in the graph) |
P.S. You can download the code and data from GitHub