I’ve updated the
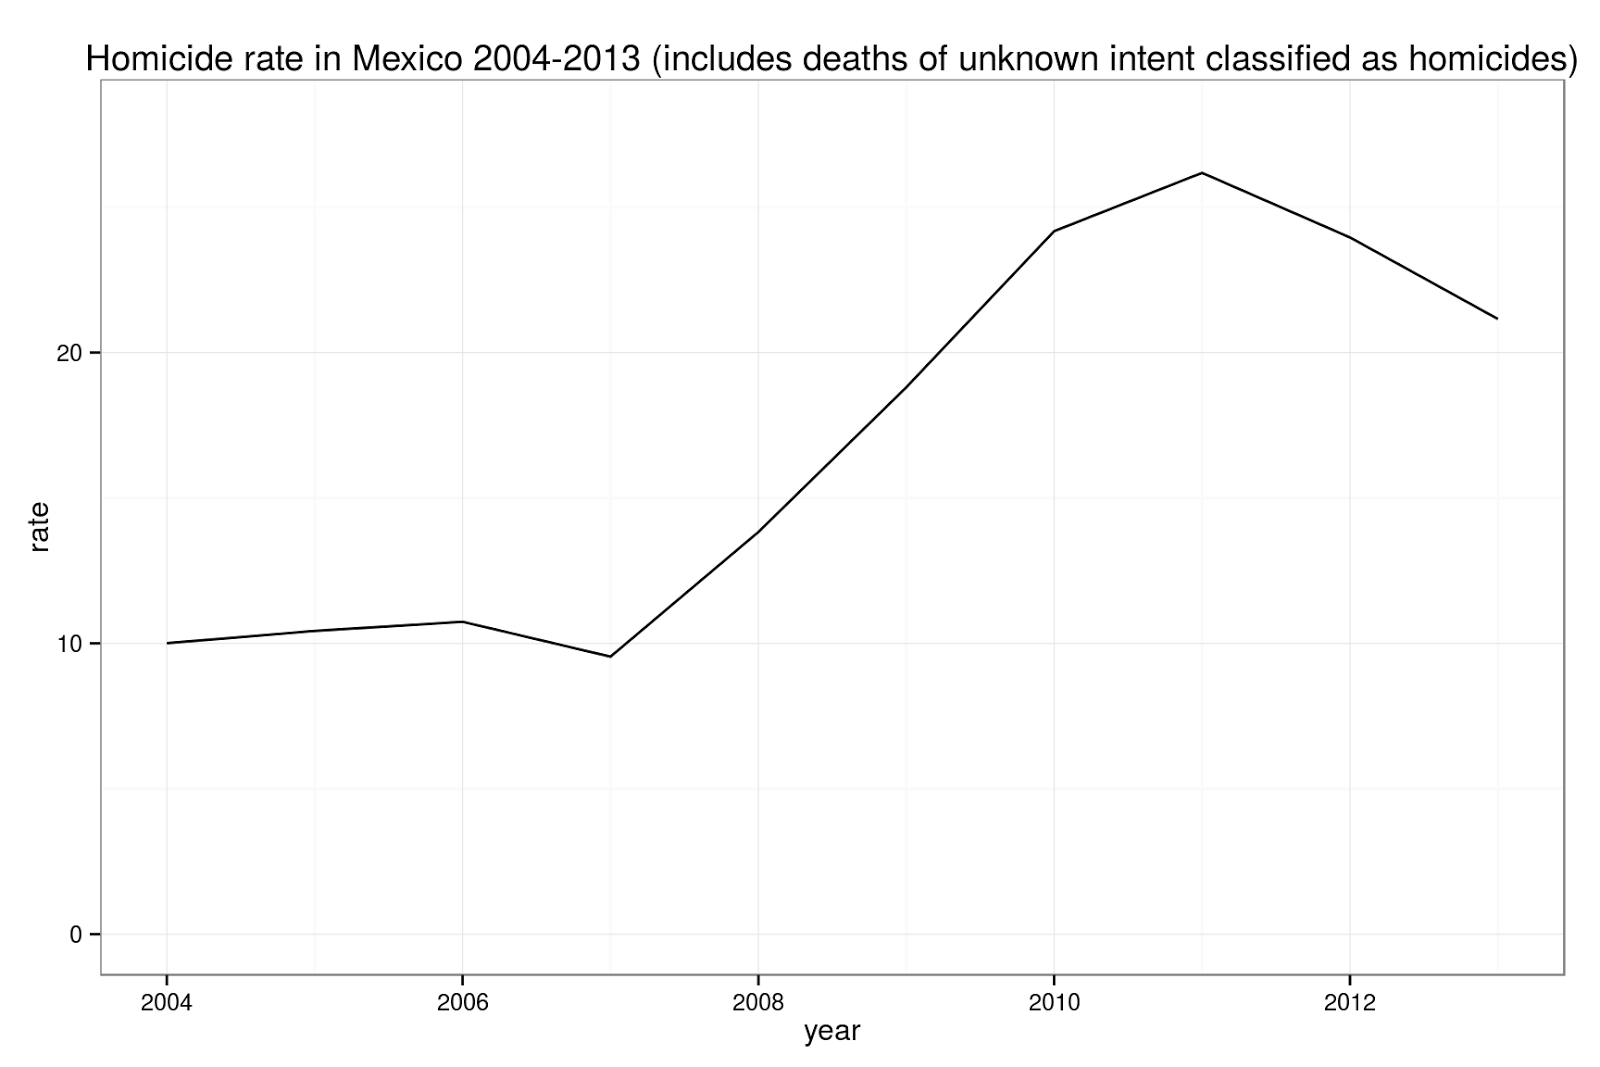
mxmortalitydb package to include 2013 data. This data only package includes all injury intent deaths (accidents, homicides, suicides, and unspcified intent) that were registered in Mexico from 2004 to 2013. You can use the package to calculate changes and trends in homicide rates in the most violent metro areas (or large municipios) or at the national level.
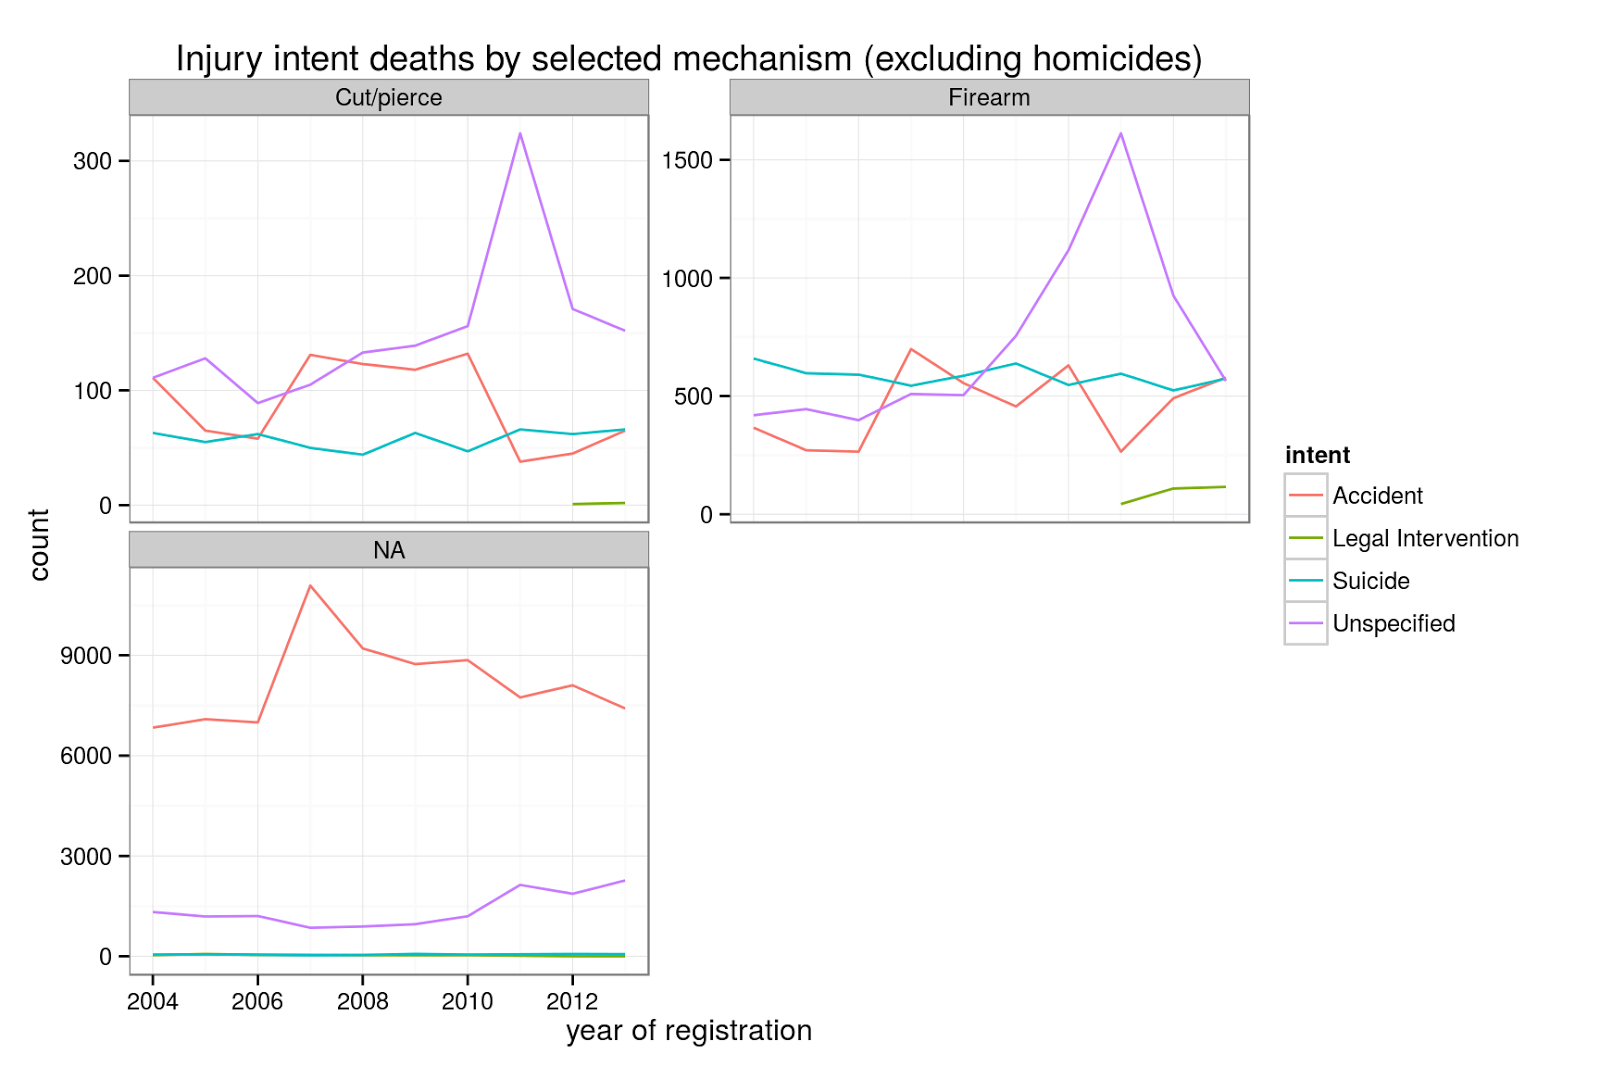
You can also use the package to explore the deaths whose intent was left unspecified (note the large increase in firearm deaths in 2011, the year Mexico had the highest homicide rate in recent history)
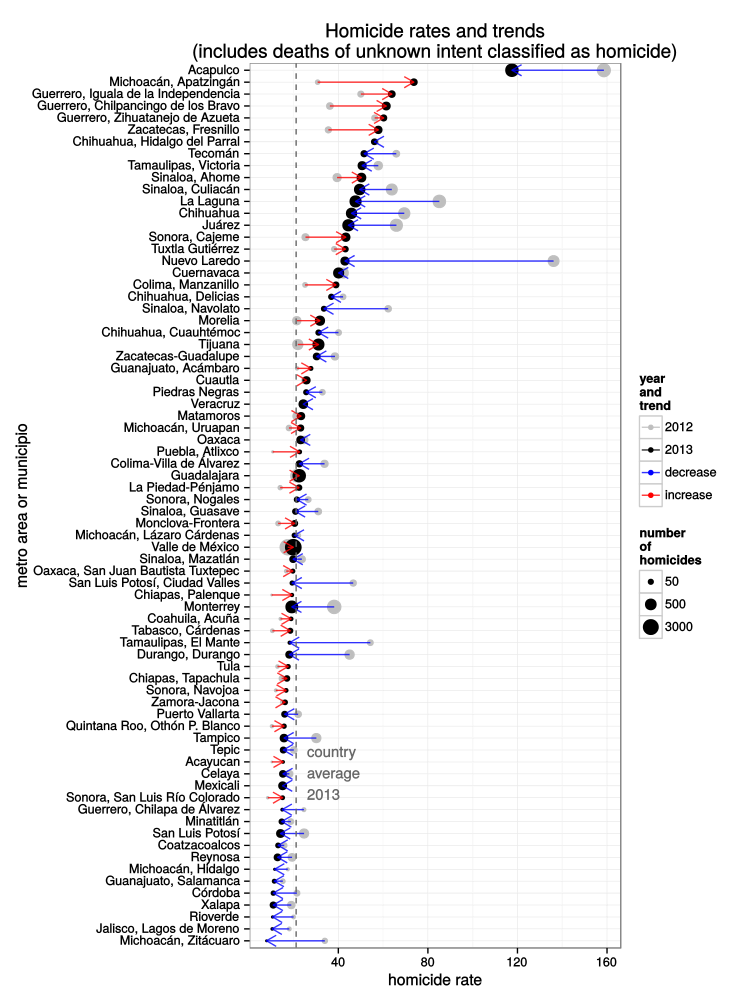
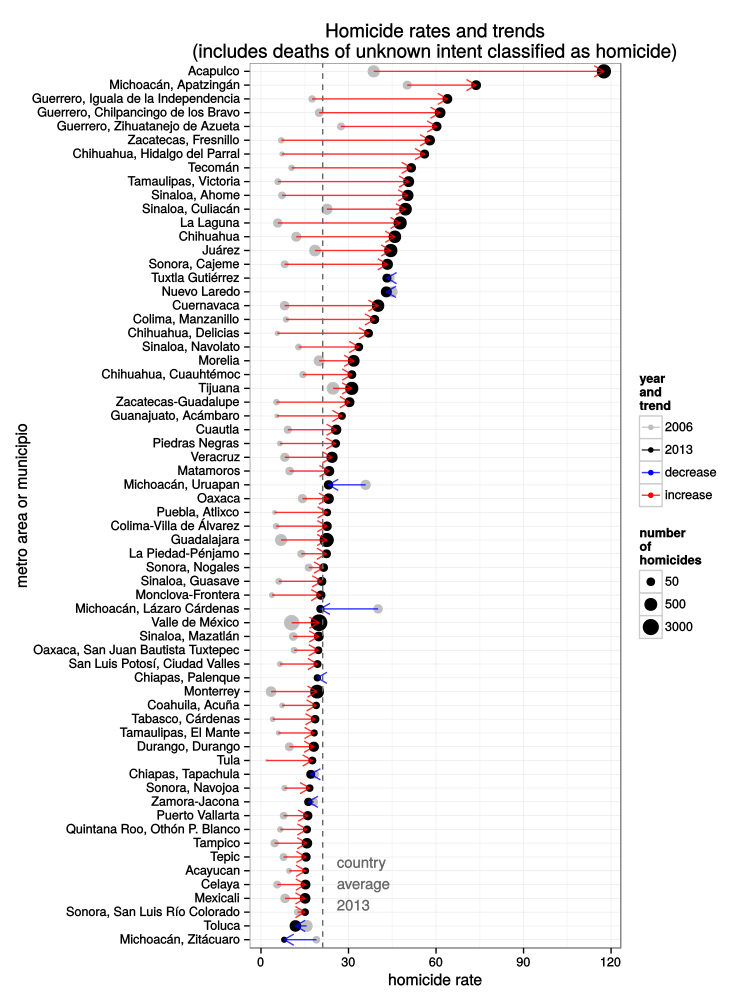
And make pretty plots of the most violent metro areas or large municipios which are not part of a metro area (in Mexico by definition a metro area has to consist of more than one municipio, so it is worthwhile to include single municipios with large populations). I should also note that the database only includes deaths where a death certificate was issued, so if there are clandestine mass graves that haven’t been found (as was the case recently in Iguala) or where the deaths somehow were not registered (as was the case with the Taxco mass grave) then the deaths are not included in the counts.
While violence has decreased in recent years it still has a long way to drop before it reaches the levels seen in 2006.
Note the mixed trend in Michoacán.
Do note that the charts of homicides from 2006 were made with the 2010 population according to the
CONAPO, so the homicide rate was underestimated by a little bit. Also, rather than using the raw homicide numbers I adjusted them by classifying deaths of unknown intent as described in the
mxmortalitydb package and this
post.
The code for generating the charts is available from
GitHub 


