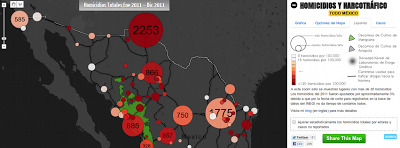
Bueno, pues he actualizado el mapa interactivo de la guerra contra el narcotráfico para incluir los datos de muertes por homicidio en el 2011 que acaba de publicar el INEGI. Al parecer el gobierno ya no va a actualizar los homicidios debido al crimen organizado (también llamados de presunta rivalidad delincuencial) pero el mapa los sigue mostrando.
Category: blogger | Atom Feed
 |
| Click on the image to visit the map |
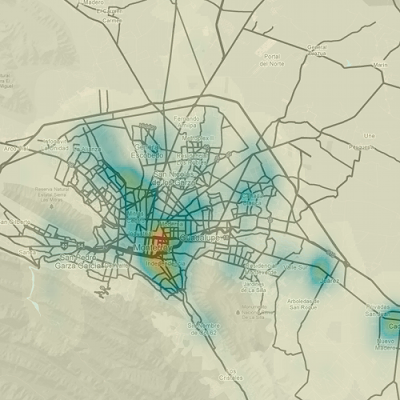
This a somewhat cleaned up 2d density map of homicides in Monterrey as reported by El Norte during all of 2012. Do take note that the map is of homicide locations rather than counts and that I removed a couple of non-homicide events that were present in the original data.
When looking at days of the year with the most homicides a pattern jumps out: violence is significantly higher during certain holidays in Mexico compared to the rest of the year. This is a well studied pattern in other countries.
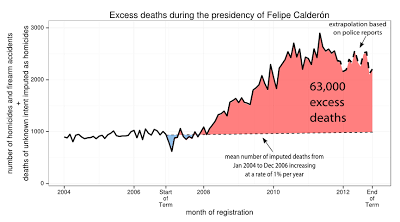
Six years ago Felipe Calderón declared war on the drug cartels soon after taking office by sending troops to his home state of Michoacán. Six years later the war still rages on as Enrique Peña Nieto starts his term of office, and everyone is taking a look at the legacy of the man who started the war.
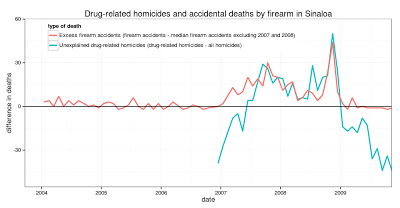
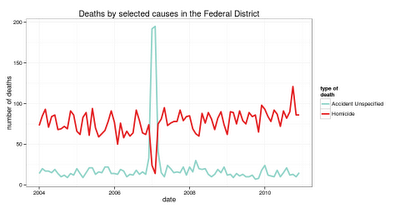
During 2007 and 2008 the Mexican state of Sinaloa had more drug war-related homicides than total homicides. This should in theory be impossible since drug war homicides are a subset of total homicides. How did this happen?
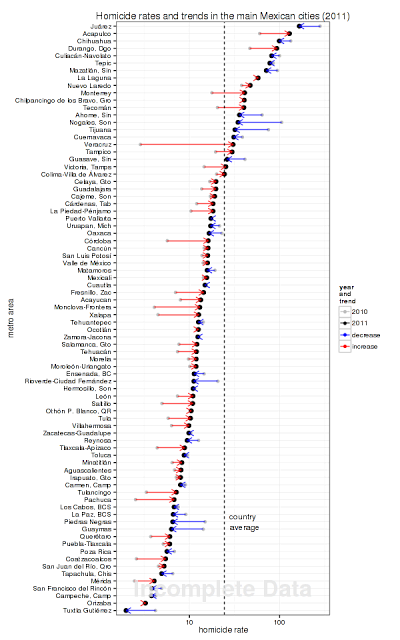 |
| Note the log scale and that data are incomplete |
The INEGI finally released homicide data at the municipality level, analyzing it by state turned out very similar results to the preliminary data released back in August, so I won’t repeat the state level charts I did back then, instead I will focus on the trends in violence at the metro area or big municipality level since both Tijuana and Ciudad Juárez had big declines in homicides —though they are still very violent— and Monterrey, Acapulco and Veracruz saw big increases.
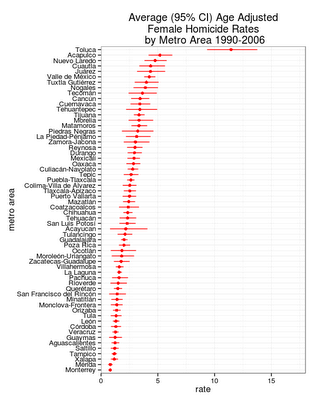
Before the drug war the metro area of Toluca was by far the most violent city in Mexico for females and not Ciudad Juarez as commonly believed, in fact, when cities are ranked by their age-adjusted homicide rates from 1990 to 2006 (right before the drug war started) Juárez was not much more violent than Mexico City (Valle de México in the chart).
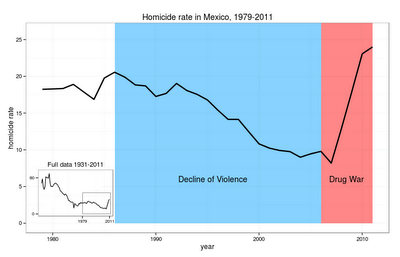
Ever since the end of the Mexican Revolution and the Cristero War violence in Mexico inched down in fits and starts from a high of about 60 homicides per 100,000 people to its lowest level sometime during the middle of the last decade (there’s some uncertainty about the number of homicides in 2007). Then, the drug war happened and the homicide rate shot straight up.
After reading The Better Angels of Our Nature: Why Violence Has Declined, by Steven Pinker, and looking at reviews of the literature on homicide decline in Europe, it seemed to me as if some of the posited reasons for the decline of violence would involve strong cohort effects —each generation successively becoming less and less violent. This immediately reminded me of Mexico, and so I decided to take a quick look at the data:
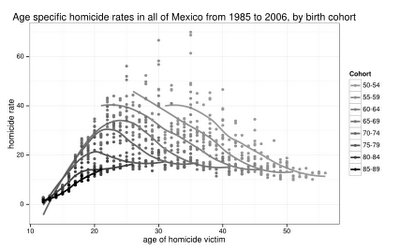 |
| Each cohort group is connected by a loess line(only ages 12-60 are shown in the graph) |
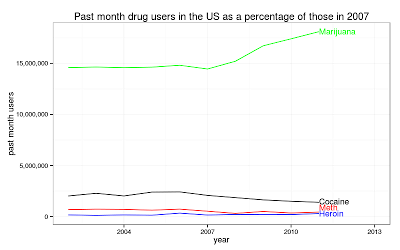
According to data from the National Survey on Drug Use & Health 2001-2011 marijuana and heroin use are up, but cocaine and methampethamine use are down. (Data on methamphetamine consumption was statistically adjusted to account for survey changes)
Unless otherwise stated, the content of this page is licensed under the Creative Commons Attribution 3.0 License, and code samples are licensed under the Apache 2.0 License. Privacy policy
Disclaimer: This website is not affiliated with any of the organizations or institutions to which Diego Valle-Jones belongs. All opinions are my own.
Special Projects:
- Mexico Crime Rates - ElCri.men: Monthly Crime Report for all of Mexico
- Mexico City Crime - HoyoDeCrimen.com: Geospatial crime map of Mexico City
- Mexico City Air Quality - HoyoDeSmog
Blogs I like:
