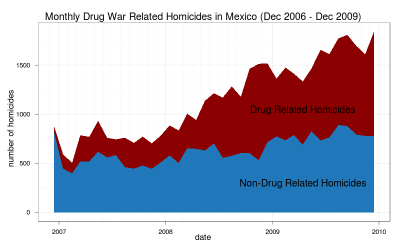
| Year | Drug-Related Homicides | Total Homicides |
| 2007 | 21 | 64 |
| 2008 | 39 | 106 |
| 2009 | 69 | 213 |
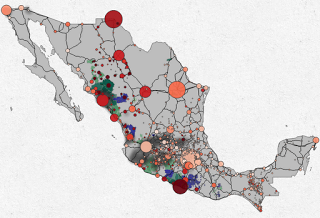 |
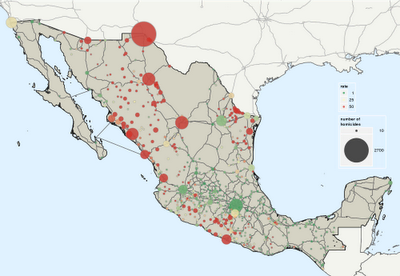
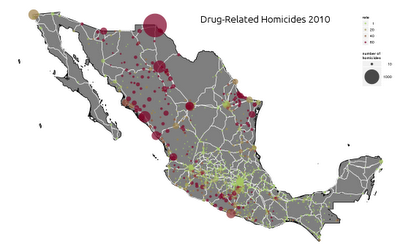
| Click on the image to go to the interactive map |
The Mexican government recently released crime data for 2011 at the municipality level. Sadly, it is no disaggregated by month, but beggars can’t be choosers. To analyze the data I made an interactive map with d3 that includes the locations of the municipalities with the highest drug plant eradication and a 2d kernel density estimate of the location of meth labs based on newspaper reports.
