Tag: statistics | Atom Feed

Statistical Analysis and Visualization of the Drug War in Mexico

On December 11, 2006 Felipe Calderon, as the first significant act of his presidency, sent the army to his home state of Michoacan. He claimed that it was to regain control of territories lost to the drug cartels, and indeed, a new cartel had started operating in Michocan. But the fact that he won the election by the slim margin of 0.6% and his main rival declared himself the legitimate president of Mexico surely influenced him.

In the beginning, the war proved a success by all objective measures: in 2007 the homicide rate decreased to its lowest level in recorded history and murders in Michoacan went down by more than 40%. Not that it mattered much, all the while the government was losing the psychological war—the use of torture and beheadings became common in executions carried out by drug cartels as they sought to protect their turfs and intimidate the population.

And then 2008 rolled around and the Sinaloa Cartel decided to take advantage of the weakening of the other cartels and the corruption that is endemic in Mexico to gain control of the drug trade…

Sources: Homicide data from INEGI, population data from CONAPO.
2009 estimate based on execution rates


Visualizing Unemployment in Mexico

What has been the impact of the economic crisis on employment? And how has it affected the different regions of Mexico?

To answer the questions the first step was to obtain the unemployment data from the Banco de Información Económica at the INEGI. The data is available only at the ...


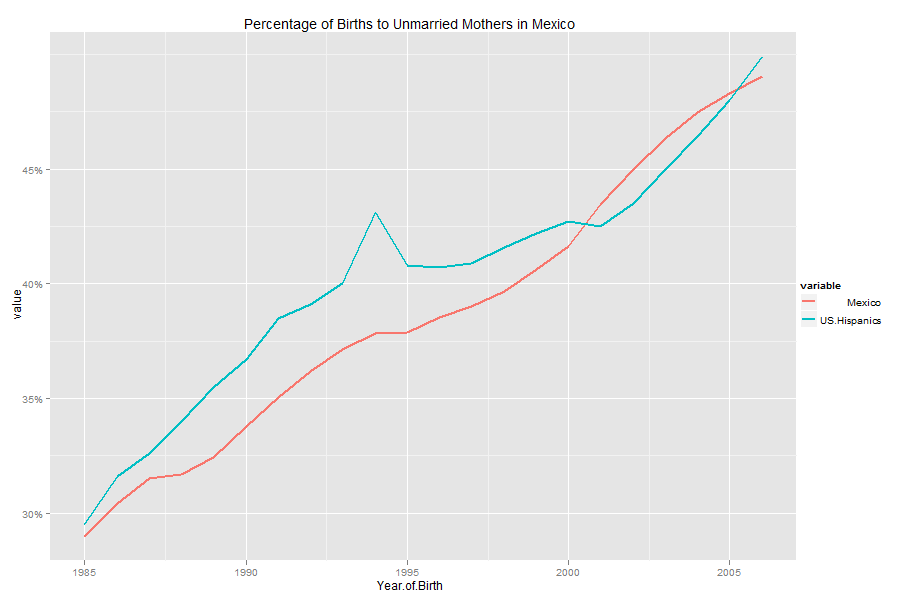
The unmarried parenthood rate in Mexico

Births to unmarried mothers


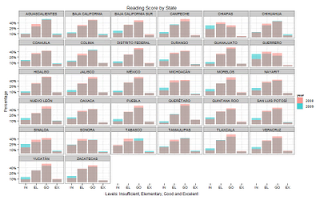
Visualizing ENLACE 2009


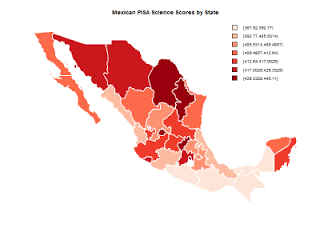
Mexican PISA Scores


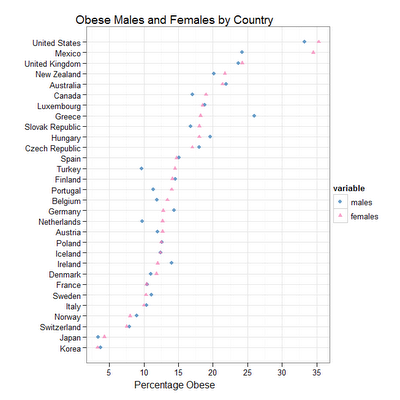
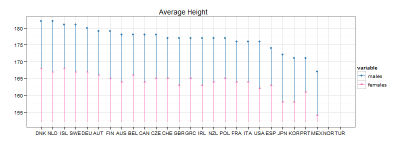
Height and Obesity by Country

No surprises here. Icelandic and Dutch women are taller than Mexican men. Data from the oecd.


How Religious is Mexico?

Wow, I didn’t expect Mexicans to be so religious, I don’t think any of my friends go to mass more than once a month. The data came from the World Values Survey and the graphs were made with Verifiable which makes much prettier stacked bar charts than Excel ...

R in the New York Times

Must be a slow news day because the New York Times has an article about the statistical software R. Israel was right to take advantage of the holiday news lull to invade Gaza.

R first appeared in 1996, when the statistics professors Ross Ihaka and Robert Gentleman of the University ...


Many Eyes vs. Google Charts

Two charts comparing Many Eyes and Google Charts:

Many Eyes


Google Charts
You can get the data for the chart here Although Many Eyes has more chart types (most of which output chart junk) its charts lack the visual appeal of Google Charts, plus Many Eyes is built with Java ...


Palabras que aparecen frecuentemente en las descripciones de mujeres


La gráfica es de las 150 palabras más comunes que aparecen en las descripciones de 3313 mujeres de 18 a 25 años que viven en la Ciudad de México y desean conocer hombres en un sitio web popular en México. La gráfica fue hecha con wordle.net

Unless otherwise stated, the content of this page is licensed under the Creative Commons Attribution 3.0 License, and code samples are licensed under the Apache 2.0 License. Privacy policy

Disclaimer: This website is not affiliated with any of the organizations or institutions to which Diego Valle-Jones belongs. All opinions are my own.

Special Projects:

Blogs I like: