The 2009 homicide numbers collected by the SNSP (National System of Public Security) are finally out, you can download the data from the ICESI, which is a civic institution not affiliated with the government.
If you remember, one of the conclusions from my statistical analysis of the drug war was that:
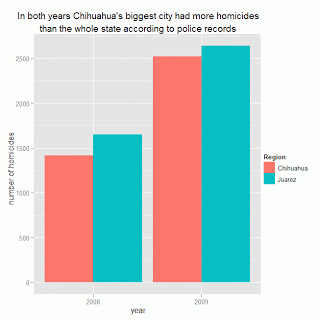
The police records in 2008 are missing more than a thousand homicides in Chihuahua! Just to give you some perspective, in Ciudad Juarez, Chihuahua’s biggest city, there were more than 1,600 homicides, more than the 1,414 reported in the whole state according to police records. I strongly recommend against using data obtained from the police records from the SNSP or the UN homicide statistics if you need the latest homicide numbers.In the latest incarnation of the data, the number of homicides in Chihuahua in 2008 were updated to 2,030 and now resemble the numbers from the Statistical Yearbooks; however, you can still download the data as it appeared in 2008 from the ICESI. At least the SNSP realized that the 2008 numbers were ridiculously low. But what about 2009, well…
I can’t compare the police records to the vital statistics since they won’t be out until November or December, but I can compare them to press reports.
In Ciudad Juarez there were 2,642 homicides during 2009, but according to the police data, in the whole state of Chihuahua there were 2,523 homicides, sigh… history repeats itself.
For the whole of Mexico there were 15,255 homicides, which if the number is to believed would correspond to a homicide rate of 14.2. I obviously don’t trust the data and stand by my assertion that the homicide rate according to the vital statistics from the INEGI will be closer to my prediction of 15.5 than 14.2.
This is getting to be completely ridiculous. The code to generate the chart is after the jump.
On December 11, 2006 Felipe Calderon, as the first significant act of his presidency, sent the army to his home state of Michoacan. He claimed that it was to regain control of territories lost to the drug cartels, and indeed, a new cartel had started operating in Michocan. But the fact that he won the election by the slim margin of 0.6% and his main rival declared himself the legitimate president of Mexico surely influenced him.
In the beginning, the war proved a success by all objective measures: in 2007 the homicide rate decreased to its lowest level in recorded history and murders in Michoacan went down by more than 40%. Not that it mattered much, all the while the government was losing the psychological war—the use of torture and beheadings became common in executions carried out by drug cartels as they sought to protect their turfs and intimidate the population.
And then 2008 rolled around and the Sinaloa Cartel decided to take advantage of the weakening of the other cartels and the corruption that is endemic in Mexico to gain control of the drug trade…
 |
| Sources: Homicide data from INEGI, population data from CONAPO. 2009 estimate based on execution rates |
Unless otherwise stated, the content of this page is licensed under the Creative Commons Attribution 3.0 License, and code samples are licensed under the Apache 2.0 License. Privacy policy
Disclaimer: This website is not affiliated with any of the organizations or institutions to which Diego Valle-Jones belongs. All opinions are my own.
Special Projects:
- Mexico Crime Rates - ElCri.men: Monthly Crime Report for all of Mexico
- Mexico City Crime - HoyoDeCrimen.com: Geospatial crime map of Mexico City
- Mexico City Air Quality - HoyoDeSmog
Blogs I like:

