Index | Archives | Feed | Tags

The 74 most violent cities in Mexico (2013)

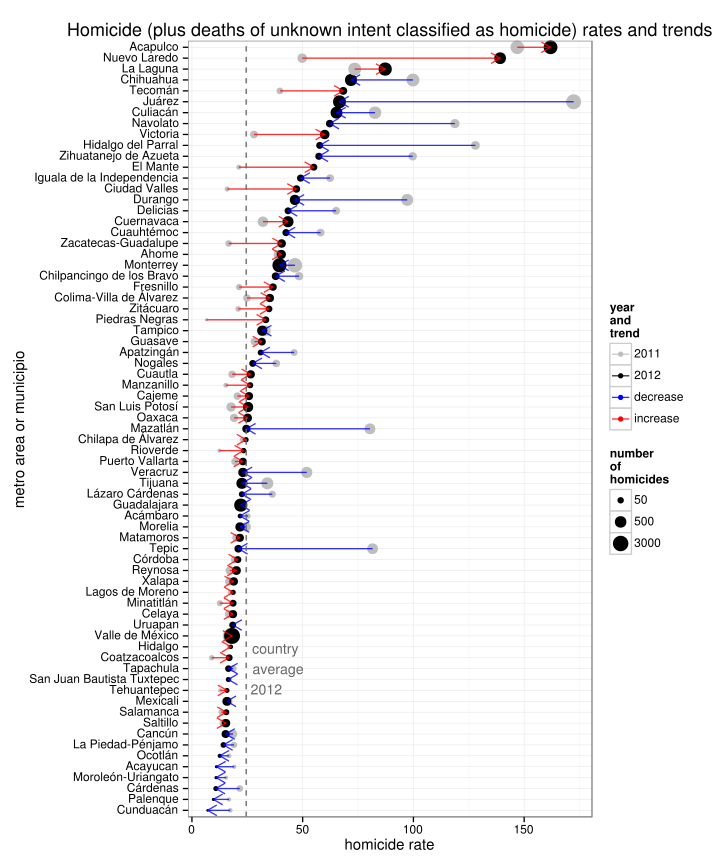
I’ve updated the mxmortalitydb package to include 2013 data. This data only package includes all injury intent deaths (accidents, homicides, suicides, and unspecified intent) that were registered in Mexico from 2004 to 2013. You can use the package to calculate changes and trends in homicide rates in the most violent metro areas (or large municipios) or at the national level.


Nobody lives here

This is an interactive map of all rural AGEBs that contain no localities and thus are empty of permanent residents. If you compare it to the US version, the total area with no people living inside it is much smaller since the data in Mexico is only available at the AGEB level (kind of like Census Tracts), whereas the data in the US is available at the Census Block level which are much smaller. Since there are no polygons available for rural localities, only points, I counted all rural AGEBs that contained a locality as being inhabited.


HoyodeCrimen.com - Crime information for the Distrito Federal


Crime information for the Federal District


Important notice regarding crimenmexico


Update: I’ve restructured crimenmexico and it’s working again.


Crime in Mexico City at the cuadrante delictivo level

This post has been superceded by hoyodecrimen.com


Analysis of the UNAM’s entrance exam

The UNAM is Mexico’s biggest and most important university. To enter it students must either take an exam or graduate from a high school run by the UNAM in less than 4 years with a grade point average of at least 70% (although some majors like medicine require 90% for pase directo). The admission exam is given twice a year, in February and June, and any student from any high school with at least a grade point average of 70% can take it. If the student meets the requirements for entering the UNAM, passing the exam guarantees him admission. The exam has 120 questions.


Interactive map of the drug war in Mexico - 2012

It’s that time of the year again when I update the interactive map of the drug war in Mexico. The map now uses 30 day months to calculate homicide rates and the new CONAPO population estimates. As usual there is also a Spanish version. All deaths registered without a date of occurrence were assumed to have occurred in the same month they were registered and all deaths without a municipio of occurrence were assumed to have taken place where they were registered. Various events are worth checking out:


Changes in homicide rates

More examples of using the mxmortalitydb package! Changes and trends in homicide rates in the most violent metro areas or big municipios. There was a big increase in violence in Nuevo Laredo. For comparison the homicide rate in Chicago (metro area) was 8.2.


An R package with all injury intent deaths registered in Mexico 2004-2012


Continuously updated crime information

Visit crimenmexico.diegovalle.net for the latest official crime information.

Unless otherwise stated, the content of this page is licensed under the Creative Commons Attribution 3.0 License, and code samples are licensed under the Apache 2.0 License. Privacy policy

Disclaimer: This website is not affiliated with any of the organizations or institutions to which Diego Valle-Jones belongs. All opinions are my own.

Special Projects:

Blogs I like: