Cleaned up Mexican population estimates by five-year age groups and gender 1990-2030 (mid-year) at the state level:
Original data from the CONAPO website
 |
| Click on the map to visit the interactive version |
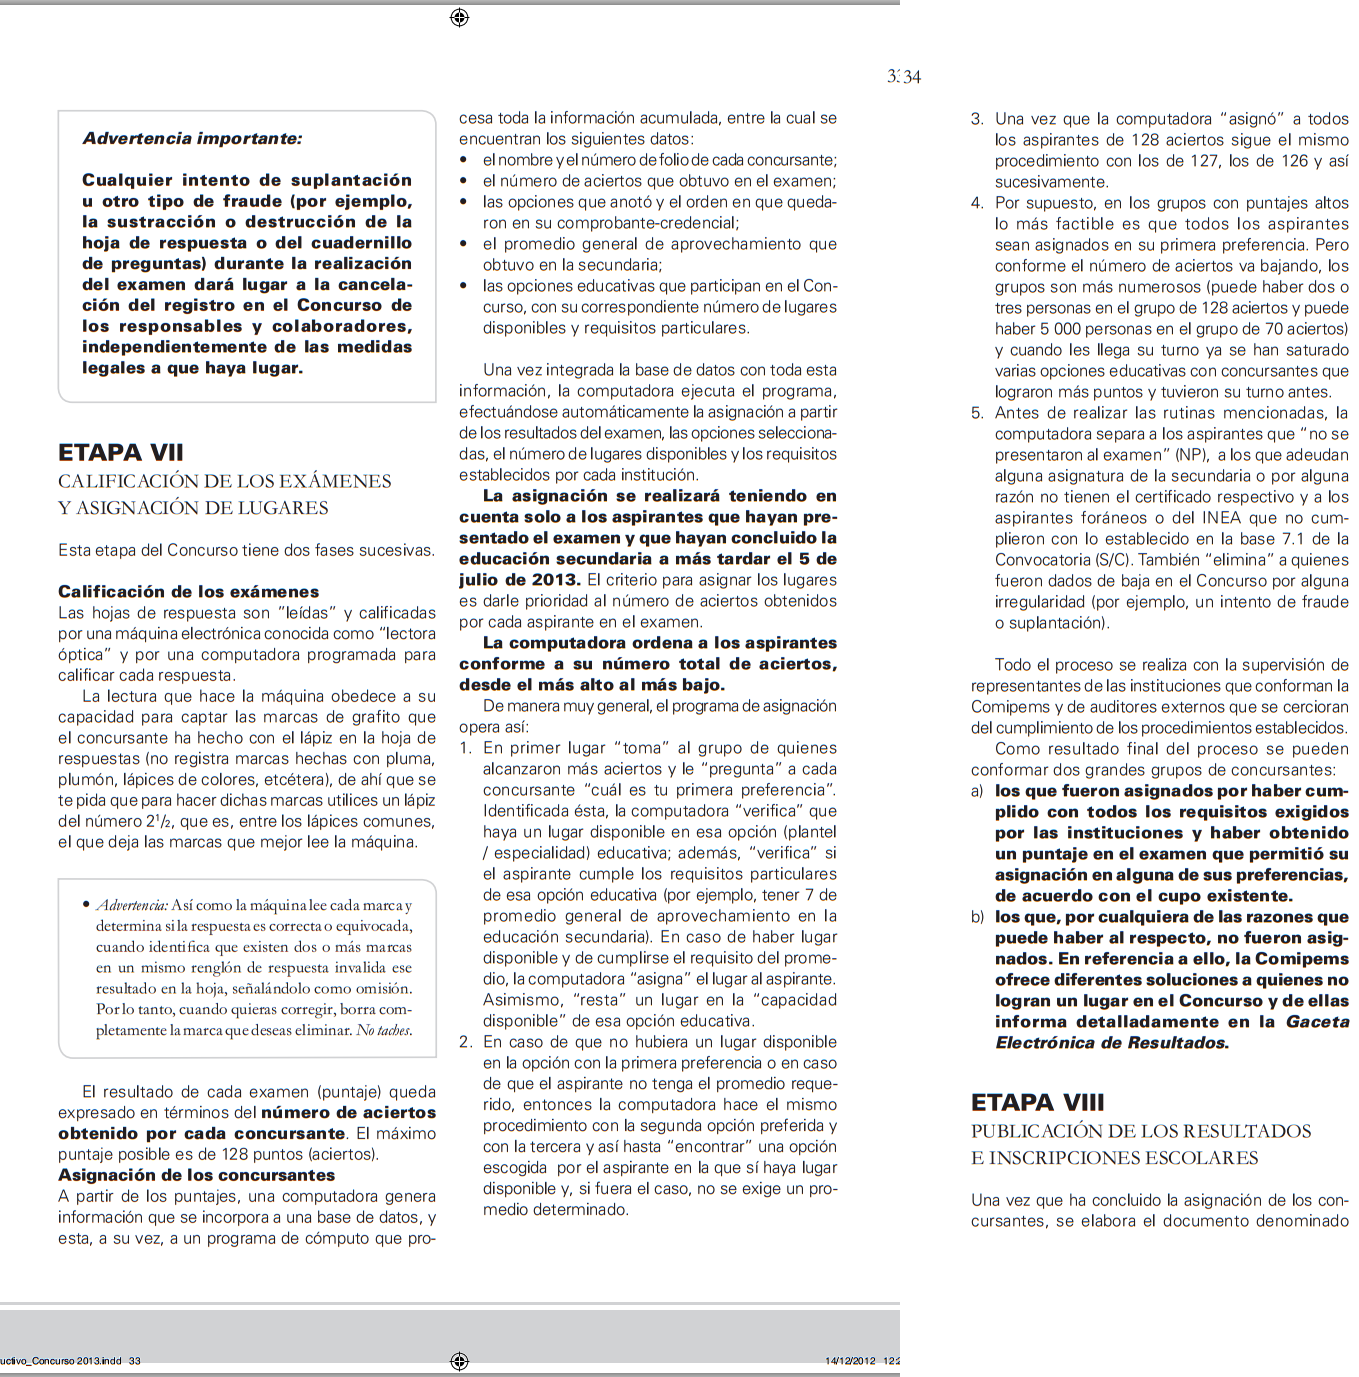
In Mexico City all ninth graders who want to enroll in a public high school (grades 10 trough 12 in Mexico) must take an exam called COMIPEMS. In order to ensure students are assigned in a fair way to a school of their choice the following steps are taken:
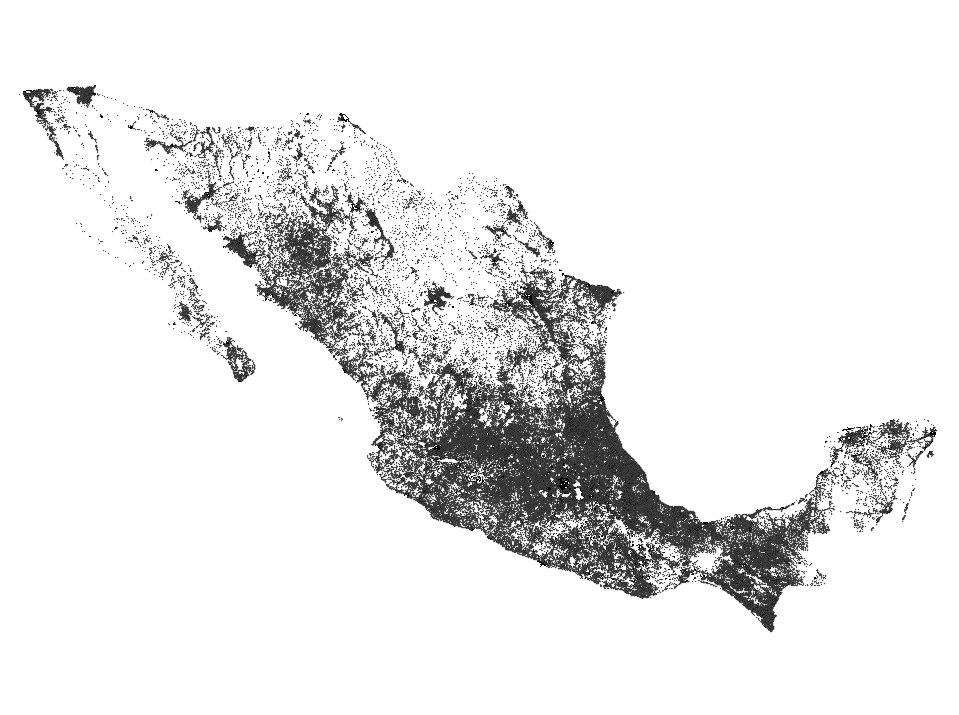
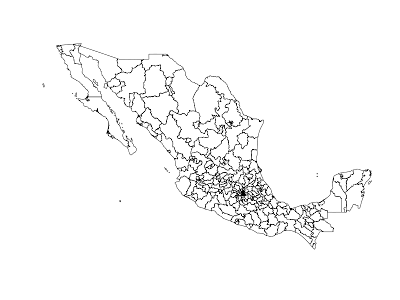
My post on how to download electoral shapefiles proved to be very popular, so I decided to create another script to download shapefiles of census geographies.
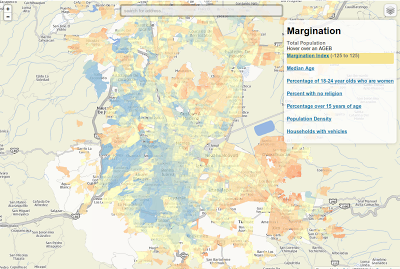
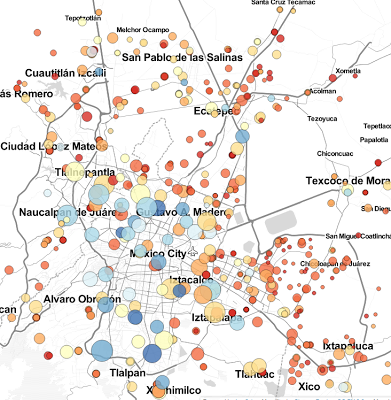
Just some maps of the Mexico City metro area based on the 2010 census. You can search by address and switch to satellite view. If the maps seem slow I suggest you use chrome.
 |
| Click on the image to visit the interactive version (Spanish) |
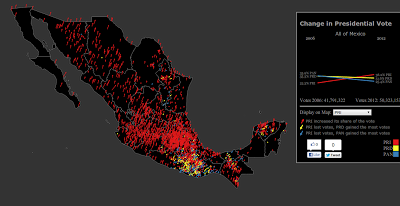
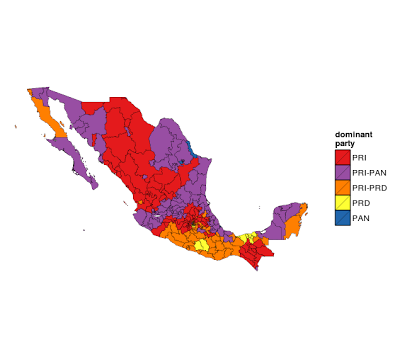
I liked this visualization by the New York Times of the US presidential election so much I decided to recreate it using Mexican data, and in the process added a slope graph. So go visit my new visualization of the change in presidential vote from 2006 to 2012 at the municipality level. I recommend using chrome to view the visualisation, there’s also a Spanish version.
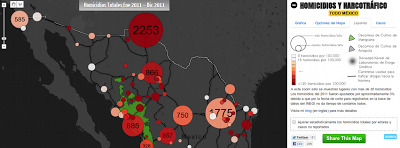
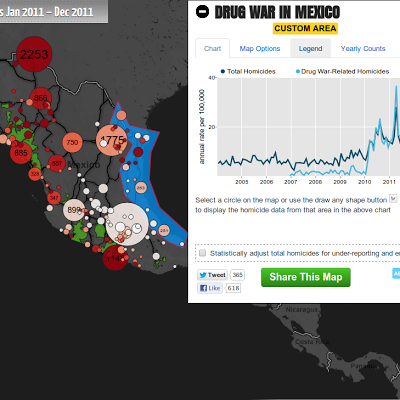
Bueno, pues he actualizado el mapa interactivo de la guerra contra el narcotráfico para incluir los datos de muertes por homicidio en el 2011 que acaba de publicar el INEGI. Al parecer el gobierno ya no va a actualizar los homicidios debido al crimen organizado (también llamados de presunta rivalidad delincuencial) pero el mapa los sigue mostrando.
 |
| Click on the image to visit the map |
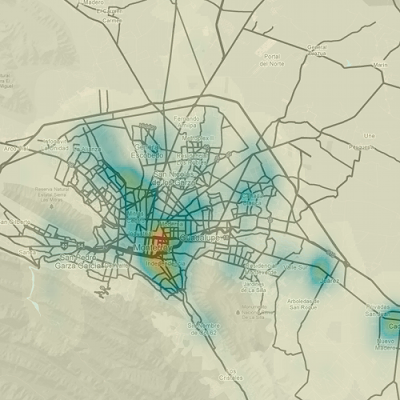
This a somewhat cleaned up 2d density map of homicides in Monterrey as reported by El Norte during all of 2012. Do take note that the map is of homicide locations rather than counts and that I removed a couple of non-homicide events that were present in the original data.
Unless otherwise stated, the content of this page is licensed under the Creative Commons Attribution 3.0 License, and code samples are licensed under the Apache 2.0 License. Privacy policy
Disclaimer: This website is not affiliated with any of the organizations or institutions to which Diego Valle-Jones belongs. All opinions are my own.
Special Projects:
Blogs I like: